Overview
Using SPARQL queries and Javascript libraries, we built a web-based tool for exploring Harvard data converted in the course of the LD4L Labs and LD4P grants. Our goals included visualizing the results of complex queries, demonstrating the use of linked data from external resources to improve discovery, giving individual items context within collections, and in the wider world, providing a user interface that aspires to serendipitous encounters and new observations. The resulting demonstration site uses WebGL and three.js to execute large-scale, three-dimensional, manipulable visualizations of entities representing library resources, driven by live queries on an AWS Neptune triplestore, the Wikidata SPARQL endpoint, and the Geonames API, with the flexibility to
Technical Outputs
Architecture
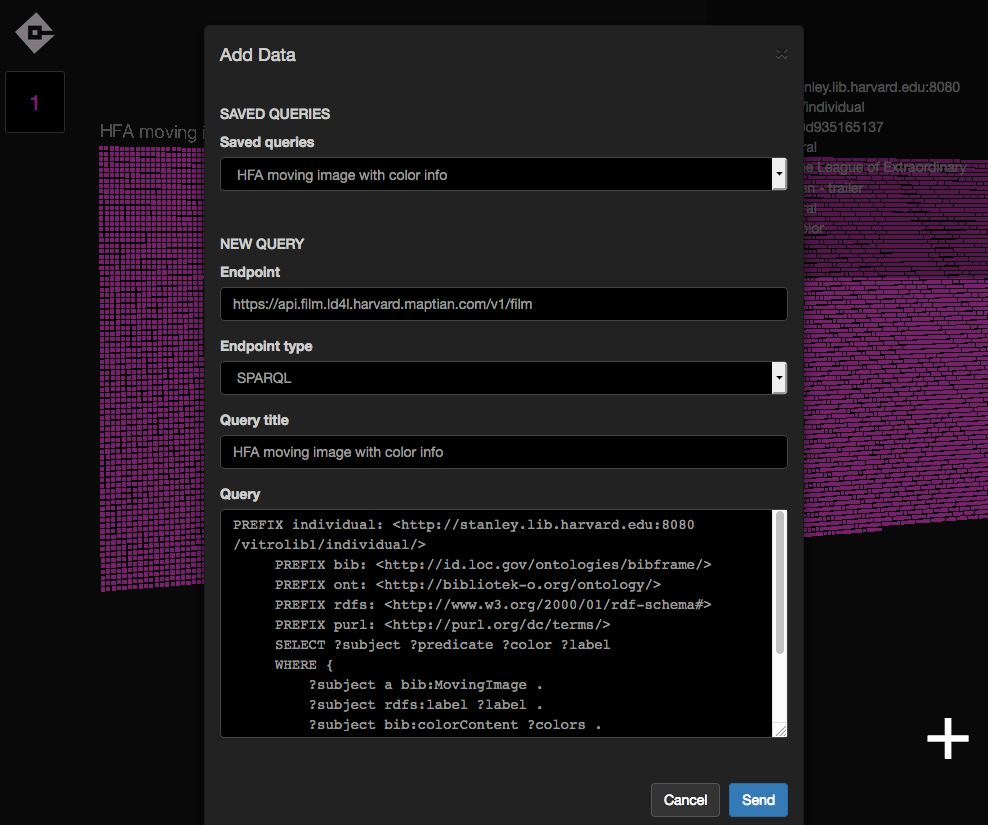
A front end visualization tool that makes real time queries against Neptune was developed. The UI includes:
- A query editor for manual input of SPARQL queries and API calls
- A dynamically-generated menu for sorting and grouping a query's results based on linked data descriptions
- Color-coding for visually distinguishing sets of results from separate queries
- Joins to support enrichment of data displayed from one query with data drawn from a different query
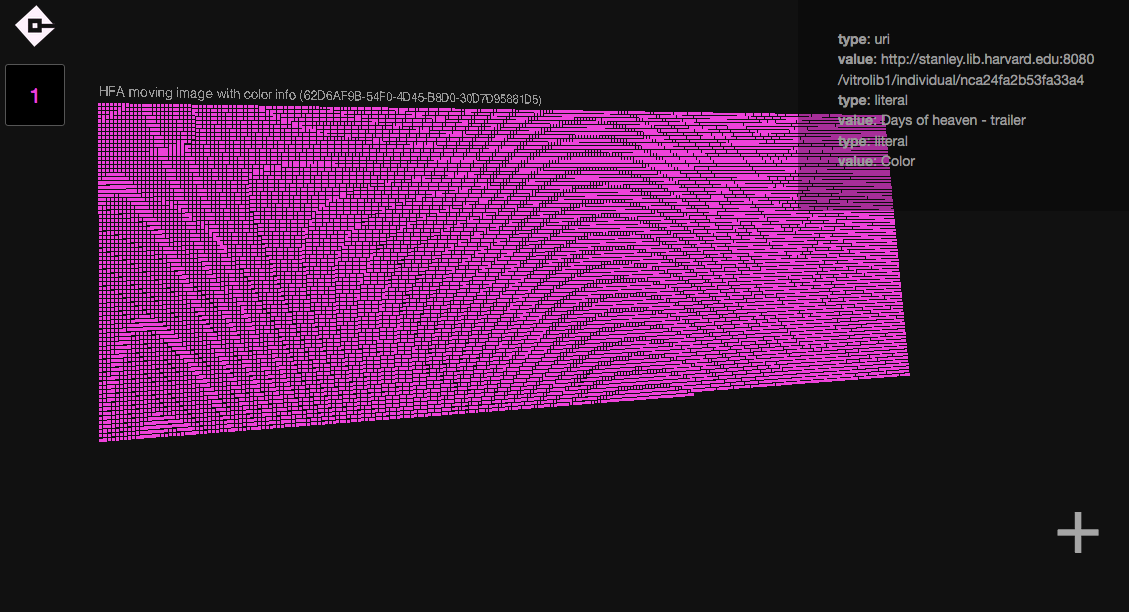
Visualization features:
- Tens of thousands of distinct resources displayed spatially, within query result sets represented as planes in three-dimensional space
- Dynamic groupings based on UI selections
- Resource description details displayed as text on mouseover, including data merged from external sources
The stack is:
- The editor is React + three.js
- The API is Node + Express
- AWS Cognito for user authentication and AWS DynamoDB for storing user and project info
Code
Code for the visualization tools can be found at:
https://github.com/ld4l-labs/geoviz
https://github.com/ld4l-labs/filmviz
Presentations and Publications
The tool was presented at the LD4 Workshop at Stanford in May 2018: https://docs.google.com/presentation/d/1kt3QzCgLRMv19b1Q234ixSaHYomOdHvb49AwhBMUvyM/edit?usp=sharing
Discussion
Demo application
See http://visualgraph.harvard.maptian.com/
Sample user interface and visualization displays:
DIsplay
UI