Page History
...
In addition to the already existing logging of pageviews and downloads, DSpace also logs search queries users enter in the DSpace search dialog and workflow events.
| Warning | ||
|---|---|---|
| ||
In DSpace 7.0x & 8.x, only usage statistics (pageview, downloads) are logged. Search statistics and workflow reports (which were available in v66.x and below) are not yet supported, but are both scheduled to be restored in a later 7.x release (currently 7.1 for workflow reports, and 7.2 for search statistics), see DSpace Release 7.0 Status. See their related tickets: https://github.com/DSpace/DSpace/issues/2880 and https://github.com/DSpace/DSpace/issues/2851 |
| Warning | ||
|---|---|---|
| ||
Only workflow events, initiated and executed by a physical user are being logged. Automated workflow steps or ingest procedures are currently not being logged by the workflow events logger. |
...
| Code Block | ||
|---|---|---|
| ||
<field name="workflowStep" type="string" indexed="true" stored="true" required="false" multiValued="true"/> <field name="previousWorkflowStep" type="string" indexed="true" stored="true" required="false" multiValued="true"/> <field name="owner" type="string" indexed="true" stored="true" required="false" multiValued="true"/> <field name="submitter" type="integer" indexed="true" stored="true" required="false" /> <field name="actor" type="integer" indexed="true" stored="true" required="false" /> <field name="workflowItemId" type="integer" indexed="true" stored="true" required="false" /> |
Web User Interface Elements
Pageview and Download statistics
In the UI, pageview and download statistics can be accessed from the "Statistics" navigation menu near the header. That statistics page is "context aware", so it will show the usage statistics for whatever page (site, Community, Collection) you are currently on.
If you are not seeing the menu, it's likely that they are only enabled for administrators in your installation. Change the configuration parameter "authorization.admin.usage" in usage-statistics.cfg to false in order to make statistics visible for all repository visitors.
Home page
Starting from the repository homepage, the statistics page displays the top 10 most popular items of the entire repository.
Community home page
The following statistics are available for the community home pages:
- Total visits of the current community home page
- Visits of the community home page over a timespan of the last 7 months
- Top 10 country from where the visits originate
- Top 10 cities from where the visits originate
Collection home page
The following statistics are available for the collection home pages:
- Total visits of the current collection home page
- Visits of the collection home over a timespan of the last 7 months
- Top 10 country from where the visits originate
- Top 10 cities from where the visits originate
Item home page
The following statistics are available for the item home pages:
- Total visits of the item
- Total visits for the bitstreams attached to the item
- Visits of the item over a timespan of the last 7 months
- Top 10 country views from where the visits originate
- Top 10 cities from where the visits originate
Search Query Statistics
| Warning | ||
|---|---|---|
| ||
Search query statistics are not supported in 7.0, but are scheduled to be released in a later 7.x release (currently 7.2), see DSpace Release 7.0 Status. The below screenshots and instructions are for 6.x and will need updating for 7.x once this feature is completed. |
In the UI, search query statistics can be accessed from the lower end of the navigation menu.
Disabling Tracking of Statistics
By default, Statistics are captured by the REST API for all visits (page hits) and downloads that occur via both the User Interface and the REST API.
Disabling statistical tracking currently must be done by modifying the backend's Spring configuration in [dspace]/config/spring/rest/event-service-listeners.xml. In that file, you must comment out the "SolrLoggerUsageEventListener" in order to disable all tracking
| Code Block | ||||
|---|---|---|---|---|
| ||||
<beans>
    ...
    <!-- Comment out this bean, as shown below, to disable all tracking of usage statistics in Solr -->
    <!-- Inject the SolrLoggerUsageEventListener into the EventService  -->
    <!--
    <bean class="org.dspace.statistics.SolrLoggerUsageEventListener">
        <property name="eventService" ref="org.dspace.services.EventService"/>
    </bean>
    -->
</beans> |
After commenting out that bean, you will need to restart Tomcat.
NOTE: This only disables tracking statistics in Solr. The "Statistics" link will still appear in the header menu of the User Interface. However, you can limit its visibility by setting it to only be visible to administrative users. Update this configuration in your local.cfg or user-statistics.cfg:
| Code Block |
|---|
# Limit access to Admins, Community/Collection Admins
usage-statistics.authorization.admin.usage = true |
| Note | ||
|---|---|---|
| ||
At this time, there is no flag to remove the "Statistics" menu link completely. See https://github.com/DSpace/DSpace/issues/9698 |
Web User Interface Elements
Pageview and Download statistics
In the UI, pageview and download statistics can be accessed from the "Statistics" navigation menu near the header. That statistics page is "context aware", so it will show the usage statistics for whatever page (site, Community, Collection) you are currently on.
If you are not seeing the menu, it's likely If you are not seeing the link labelled "search statistics", it is likely that they are only enabled for administrators in your installation. Change the configuration parameter "authorization.admin.searchusage" in usage-statistics.cfg to false in order to make statistics visible for all repository visitors.
The dropdown on top of the page allows you to modify the time frame for the displayed statistics.
The Pageviews/Search column tracks the amount of pages visited after a particular search term. Therefor a zero in this column means that after executing a search for a specific keyword, not a single user has clicked a single result in the list.
If you are using Discovery, note that clicking the facets also counts as a search, because clicking a facet sends a search query to the Discovery index.
Workflow Event Statistics
| Warning | ||
|---|---|---|
| ||
Workflow event statistics are not supported in 7.0, but are scheduled to be released in a later 7.x release (currently 7.1), see DSpace Release 7.0 Status. The below screenshots and instructions are for 6.x and will need updating for 7.x once this feature is completed. |
In the UI, search query statistics can be accessed from the lower end of the navigation menu.
If you are not seeing the link labelled "Workflow statistics", it is likely that they are only enabled for administrators in your installation. Change the configuration parameter "authorization.admin.workflow" in usage-statistics.cfg to false in order to make statistics visible for all repository visitors.
The dropdown on top of the page allows you to modify the time frame for the displayed statistics.
Architecture
The DSpace Statistics Implementation is a Client/Server architecture based on Solr for collecting usage events in the JSPUI and XMLUI user interface applications of DSpace. Solr runs as a separate webapplication and an instance of Apache Http Client is utilized to allow parallel requests to log statistics events into this Solr instance.
Configuration settings for Statistics
In the {dspace.dir}/config/modules/solr-statistics.cfg file review the following fields. These fields can be edited in place, or overridden in your own local.cfg config file (see Configuration Reference).
Home page
Starting from the repository homepage, the statistics page displays the top 10 most popular items of the entire repository.
Community home page
The following statistics are available for the community home pages:
- Total visits of the current community home page
- Visits of the community home page over a timespan of the last 7 months
- Top 10 country from where the visits originate
- Top 10 cities from where the visits originate
Collection home page
The following statistics are available for the collection home pages:
- Total visits of the current collection home page
- Visits of the collection home over a timespan of the last 7 months
- Top 10 country from where the visits originate
- Top 10 cities from where the visits originate
Item home page
The following statistics are available for the item home pages:
- Total visits of the item
- Total visits for the bitstreams attached to the item
- Visits of the item over a timespan of the last 7 months
- Top 10 country views from where the visits originate
- Top 10 cities from where the visits originate
Search Query Statistics
| Warning | ||
|---|---|---|
| ||
Search query statistics are only supported in DSpace 6.x and below at this time. The below screenshots and instructions are for 6.x and will need updating if this feature is ported to later versions of DSpace. See https://github.com/DSpace/DSpace/issues/2880 |
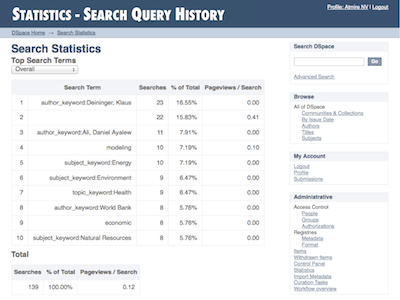
In the UI, search query statistics can be accessed from the lower end of the navigation menu.
If you are not seeing the link labelled "search statistics", it is likely that they are only enabled for administrators in your installation. Change the configuration parameter "authorization.admin.search" in usage-statistics.cfg to false in order to make statistics visible for all repository visitors.
The dropdown on top of the page allows you to modify the time frame for the displayed statistics.
The Pageviews/Search column tracks the amount of pages visited after a particular search term. Therefor a zero in this column means that after executing a search for a specific keyword, not a single user has clicked a single result in the list.
If you are using Discovery, note that clicking the facets also counts as a search, because clicking a facet sends a search query to the Discovery index.
Workflow Event Statistics
| Warning | ||
|---|---|---|
| ||
Workflow Event statistics are only supported in DSpace 6.x and below at this time. The below screenshots and instructions are for 6.x and will need updating if this feature is ported to later versions of DSpace. See https://github.com/DSpace/DSpace/issues/2851 |
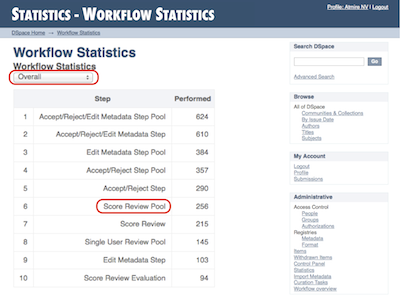
In the UI, search query statistics can be accessed from the lower end of the navigation menu.
If you are not seeing the link labelled "Workflow statistics", it is likely that they are only enabled for administrators in your installation. Change the configuration parameter "authorization.admin.workflow" in usage-statistics.cfg to false in order to make statistics visible for all repository visitors.
The dropdown on top of the page allows you to modify the time frame for the displayed statistics.
Architecture
The DSpace Statistics Implementation is a Client/Server architecture based on Solr for collecting usage events in the User Interface or REST API applications of DSpace. Solr must be installed separately from DSpace.
Configuration settings for Statistics
In the {dspace.dir}/config/modules/solr-statistics.cfg file review the following fields. These fields can be edited in place, or overridden in your own local.cfg config file (see Configuration Reference).
Property: | solr-statistics.server | ||||
Example Values: | solr-statistics.server = http://127.0.0.1/solr/statistics | ||||
Informational Note: | Is used by the SolrLogger Client class to connect to the Solr server over http and perform updates and queries. In most cases, this can (and should) be set to localhost (or 127.0.0.1).
Assuming you get an HTTP 200 OK response, then you should set | ||||
Property: | solr-statistics.query.filter.bundles | ||||
Example | solr-statistics.query.filter.bundles=ORIGINAL | ||||
Informational | A comma seperated list that contains the bundles for which the file statistics will be displayed. | ||||
Property: | solr-statistics.query.filter.spiderIp | ||||
Example Value: | solr-statistics.query.filter.spiderIp = false | ||||
Informational Note: | If true, statistics queries will filter out spider IPs -- use with caution, as this often results in extremely long query strings | ||||
Property: | solr-statistics.server | ||||
Example Values: | solr-statistics.server = http://127.0.0.1/solr/statistics | Informational Note: | Is used by the SolrLogger Client class to connect to the Solr server over http and perform updates and queries. In most cases, this can (and should) be set to localhost (or 127.0.0.1).
| Code Block |
|---|
wget http://127.0.0.1/solr/statistics/select?q=*:* |
Assuming you get an HTTP 200 OK response, then you should set solr.log.server to the '/statistics' URL of 'http://127.0.0.1/solr/statistics' (essentially removing the "/select?q=:" query off the end of the responding URL.)
Property:
solr-statistics.query.filter.bundles
Example
Value:
solr-statistics.query.filter.bundles=ORIGINAL
Informational
Note:
A comma seperated list that contains the bundles for which the file statistics will be displayed.
Property:
solr-statistics.query.filter.spiderIp
Example Value:
solr-statistics.query.filter.spiderIp = false
Informational Note:
If true, statistics queries will filter out spider IPs -- use with caution, as this often results in extremely long query strings.
Property:
solr-statistics.query.filter.isBot
Example Value:
solr-statistics.query.filter.isBot = true
Informational Note:
If true, statistics queries will filter out events flagged with the "isBot" field. This is the recommended method of filtering spiders from statistics.
If false, then view statistics will be committed to Solr immediately (i.e. via an explicit commit call). This setting is untested in Production scenarios, and is primarily used by automated integration tests (to verify that the statistics engine is working properly)
.
Property:
solr-statistics.
query.filter.
isBot
Example Value:
solr-statistics.query.
filter.
isBot = true
Informational Note:
If true, statistics queries will filter out events flagged with the "isBot" field. This is the recommended method of filtering spiders from statistics.
If false, then view statistics will be committed to Solr immediately (i.e. via an explicit commit call). This setting is untested in Production scenarios, and is primarily used by automated integration tests (to verify that the statistics engine is working properly).
Property:
solr-statistics.spiderips.urls
Example Value:
solr-statistics.spiderips.urls =
| Code Block |
|---|
http: |
| Code Block |
http://iplists.com/google.txt, \ http://iplists.com/inktomi.txt, \ http://iplists.com/lycos.txt, \ http://iplists.com/infoseek.txt, \ http://iplists.com/altavista.txt, \ http://iplists.com/excitegoogle.txt, \ http://iplists.com/miscinktomi.txt , \ http://iplists.com/lycos.txt, \ http://iplists.com/infoseek.txt, \ http://iplists.com/altavista.txt, \ http://iplists.com/excite.txt, \ http://iplists.com/misc.txt |
Informational Note:
List of
Informational Note:
List of URLs to download spiders files into [dspace]/config/spiders. These files contain lists of known spider IPs and are utilized by the SolrLogger to flag usage events with an "isBot" field, or ignore them entirely.
The "stats-util" command can be used to force an update of spider files, regenerate "isBot" fields on indexed events, and delete spiders from the index. For usage, run:
| Code Block |
|---|
dspace stats-util -h |
from your [dspace]/bin directory
...
Pre-1.6 Statistics settings
| Warning | |||
|---|---|---|---|
| |||
Search query statistics are only supported in DSpace 6.x and below at this time. See https://github.com/DSpace/DSpace/issues/2852Log-based statistics not supported in 7.0. They are under discussion as this feature is not widely used. Tentatively they are scheduled for a possible release/replacement in 7.1, see DSpace Release 7.0 Status. |
Older versions of DSpace featured static reports generated from the log files. They still persist in DSpace today but are completely independent from the SOLR based statistics.
The following configuration parameters applicable to these reports can be found in dspace.cfg.
| Code Block |
|---|
###### Statistical Report Configuration Settings ######

 # should the stats be publicly available?  should be set to false if you only
 # want administrators to access the stats, or you do not intend to generate
 # any
 report.public = false

 # directory where live reports are stored
 report.dir = ${dspace.dir}/reports/
|
These fields are not used by the new 1.6 Statistics, but are only related to the Statistics from previous DSpace releases
Statistics Administration
Converting older DSpace logs into SOLR usage data
If you have upgraded from a previous version of DSpace, converting older log files ensures that you carry over older usage stats from before the upgrade.
Statistics Client Utility
administrators to access the stats, or you do not intend to generate
 # any
 report.public = false

 # directory where live reports are stored
 report.dir = ${dspace.dir}/reports/
|
These fields are not used by the new 1.6 Statistics, but are only related to the Statistics from previous DSpace releases
Statistics Administration
Converting older DSpace logs into SOLR usage data
If you have upgraded from a previous version of DSpace, converting older log files ensures that you carry over older usage stats from before the upgrade.
Statistics Client Utility
The command line interface (CLI) scripts can be used to clean the usage database from additional spider traffic and other maintenance tasks. As of DSpace 3.0, a script has been added to split up the monolithic SOLR core into individual cores each containing a year of statistics.
Anonymizing Statistics
DSpace provides a commandline script (./dspace anonymize-statistics) which allows you to anonymize your statistics to better comply with GDPR and similar privacy regulations.
The script will anonymise the IP values by rewriting (‘masking’) the last part. This mask is configurable, both for ipv4 and ipv6 addresses.
- For IPv4 addresses, the last number will be replaced by the mask, defined by the configuration key ‘anonymise_statistics.ip_v4_mask’ which defaults to ‘254’.
For example, 109.74.16.171 is rewritten as 109.74.16.254 - For IPv6 address, the last two numbers will be replaced by the mask, defined by the configuration key ‘anonymise_statistics.ip_v6_mask’ which defaults to ‘FFFF:FFFF’. For example, 2001:0db8:85a3:0000:0000:8a2e:0370:7334 is rewritten as 2001:0db8:85a3:0000:0000:8a2e:FFFF:FFFF
For each anonymised record, the DNS field is also replaced by “anonymised”.
Script options available:
- The program only processes records older than 90 days. This period can be altered with the config ‘anonymise_statistics.time_limit’ (expressed in days) in usage-statistics.cfg.
- "-s [sleep]" : The script takes an optional parameter ‘-s [sleep]’ (expressed in ms), which will make the Java thread sleep between the calls to Solr to reduce the load impact.
- "-t [threads]" : The Solr service commit mechanism is also optimised by adding multi-threading support. The script takes an optional parameter ‘-t [threads]’ to indicate how many threads the Solr service can use for this, if not given the thread count defaults to 2.
Statistical records can also be anonymised the moment they are created. Enabling this feature can be done by setting the configuration parameter "anonymise_statistics.anonymise_on_log" to true in "usage-statististics.cfg" When this configuration property is not set, the feature is disabled by defaultThe command line interface (CLI) scripts can be used to clean the usage database from additional spider traffic and other maintenance tasks. As of DSpace 3.0, a script has been added to split up the monolithic SOLR core into individual cores each containing a year of statistics.
Custom Reporting - Querying SOLR Directly
...
Overview
Content Tools