As of 18 August 2021
- 596 unique users in production
- additional 240 unique users on stage and not on production
As of 18 August 2020
- 413 unique users in production
- 127 unique organizations represented by production users
- additional 171 unique users on stage and not on production
The below charts reflect users in production of 18 August 2020
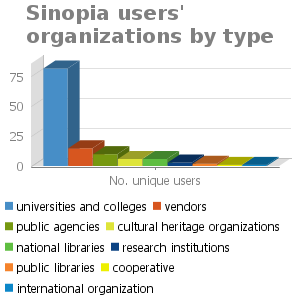
| Organization type | No. unique users |
|---|---|
universities and colleges | 82 |
| vendors | 15 |
| public agencies | 10 |
| cultural heritage organizations | 6 |
| national libraries | 6 |
| research institutions | 3 |
| public libraries | 2 |
| cooperative | 1 |
| international organization | 1 |
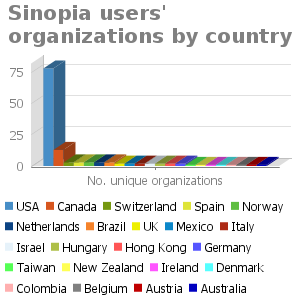
| Country | No. unique organizations |
|---|---|
| USA | 78 |
| Canada | 13 |
| Switzerland | 3 |
| Spain | 3 |
| Norway | 3 |
| Netherlands | 3 |
| Brazil | 3 |
| UK | 2 |
| Mexico | 2 |
| Italy | 2 |
| Israel | 2 |
| Hungary | 2 |
| Hong Kong | 2 |
| Germany | 2 |
| Taiwan | 1 |
| New Zealand | 1 |
| Ireland | 1 |
| Denmark | 1 |
| Colombia | 1 |
| Belgium | 1 |
| Austria | 1 |
| Australia | 1 |