Test Results
- The test was run a total of 42 times (6 values of thread count and 7 values of file size)
- The results are logged to csv files and have been placed in the log directory
- Graphs were generated using R for statistical computing and graphics
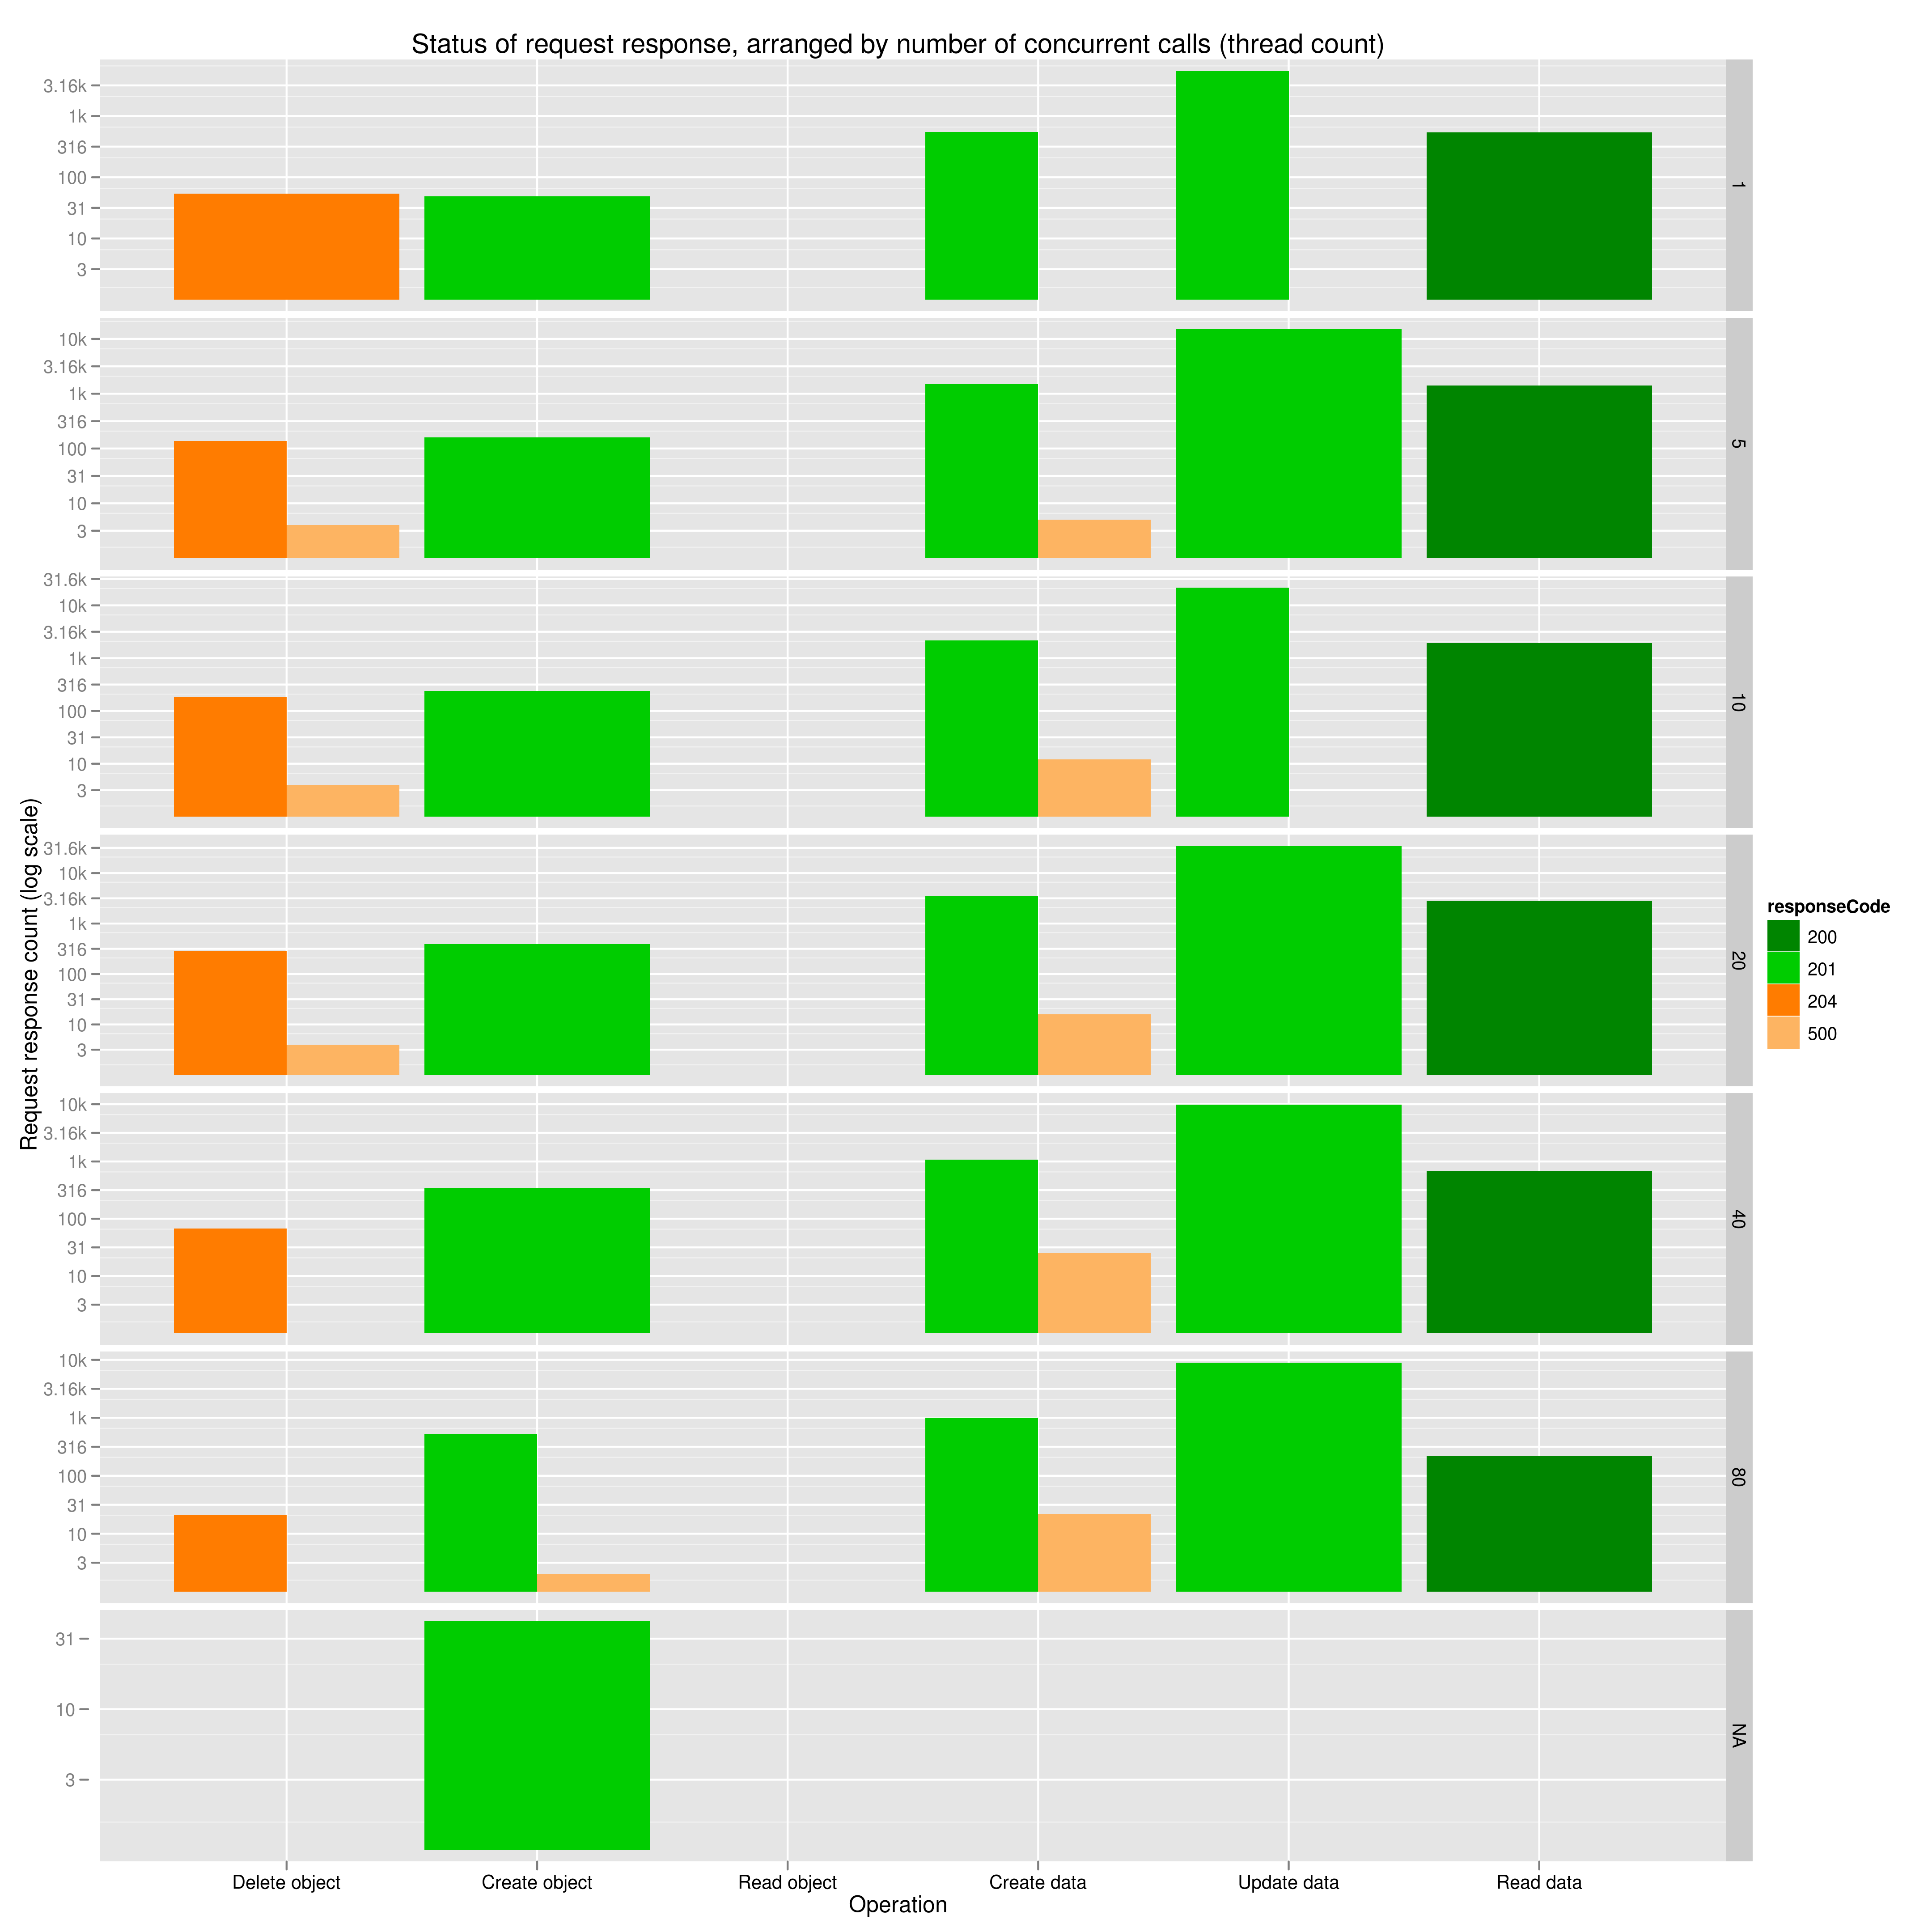
A stacked bar chart of the different response codes received, grouped by thread count
- git source
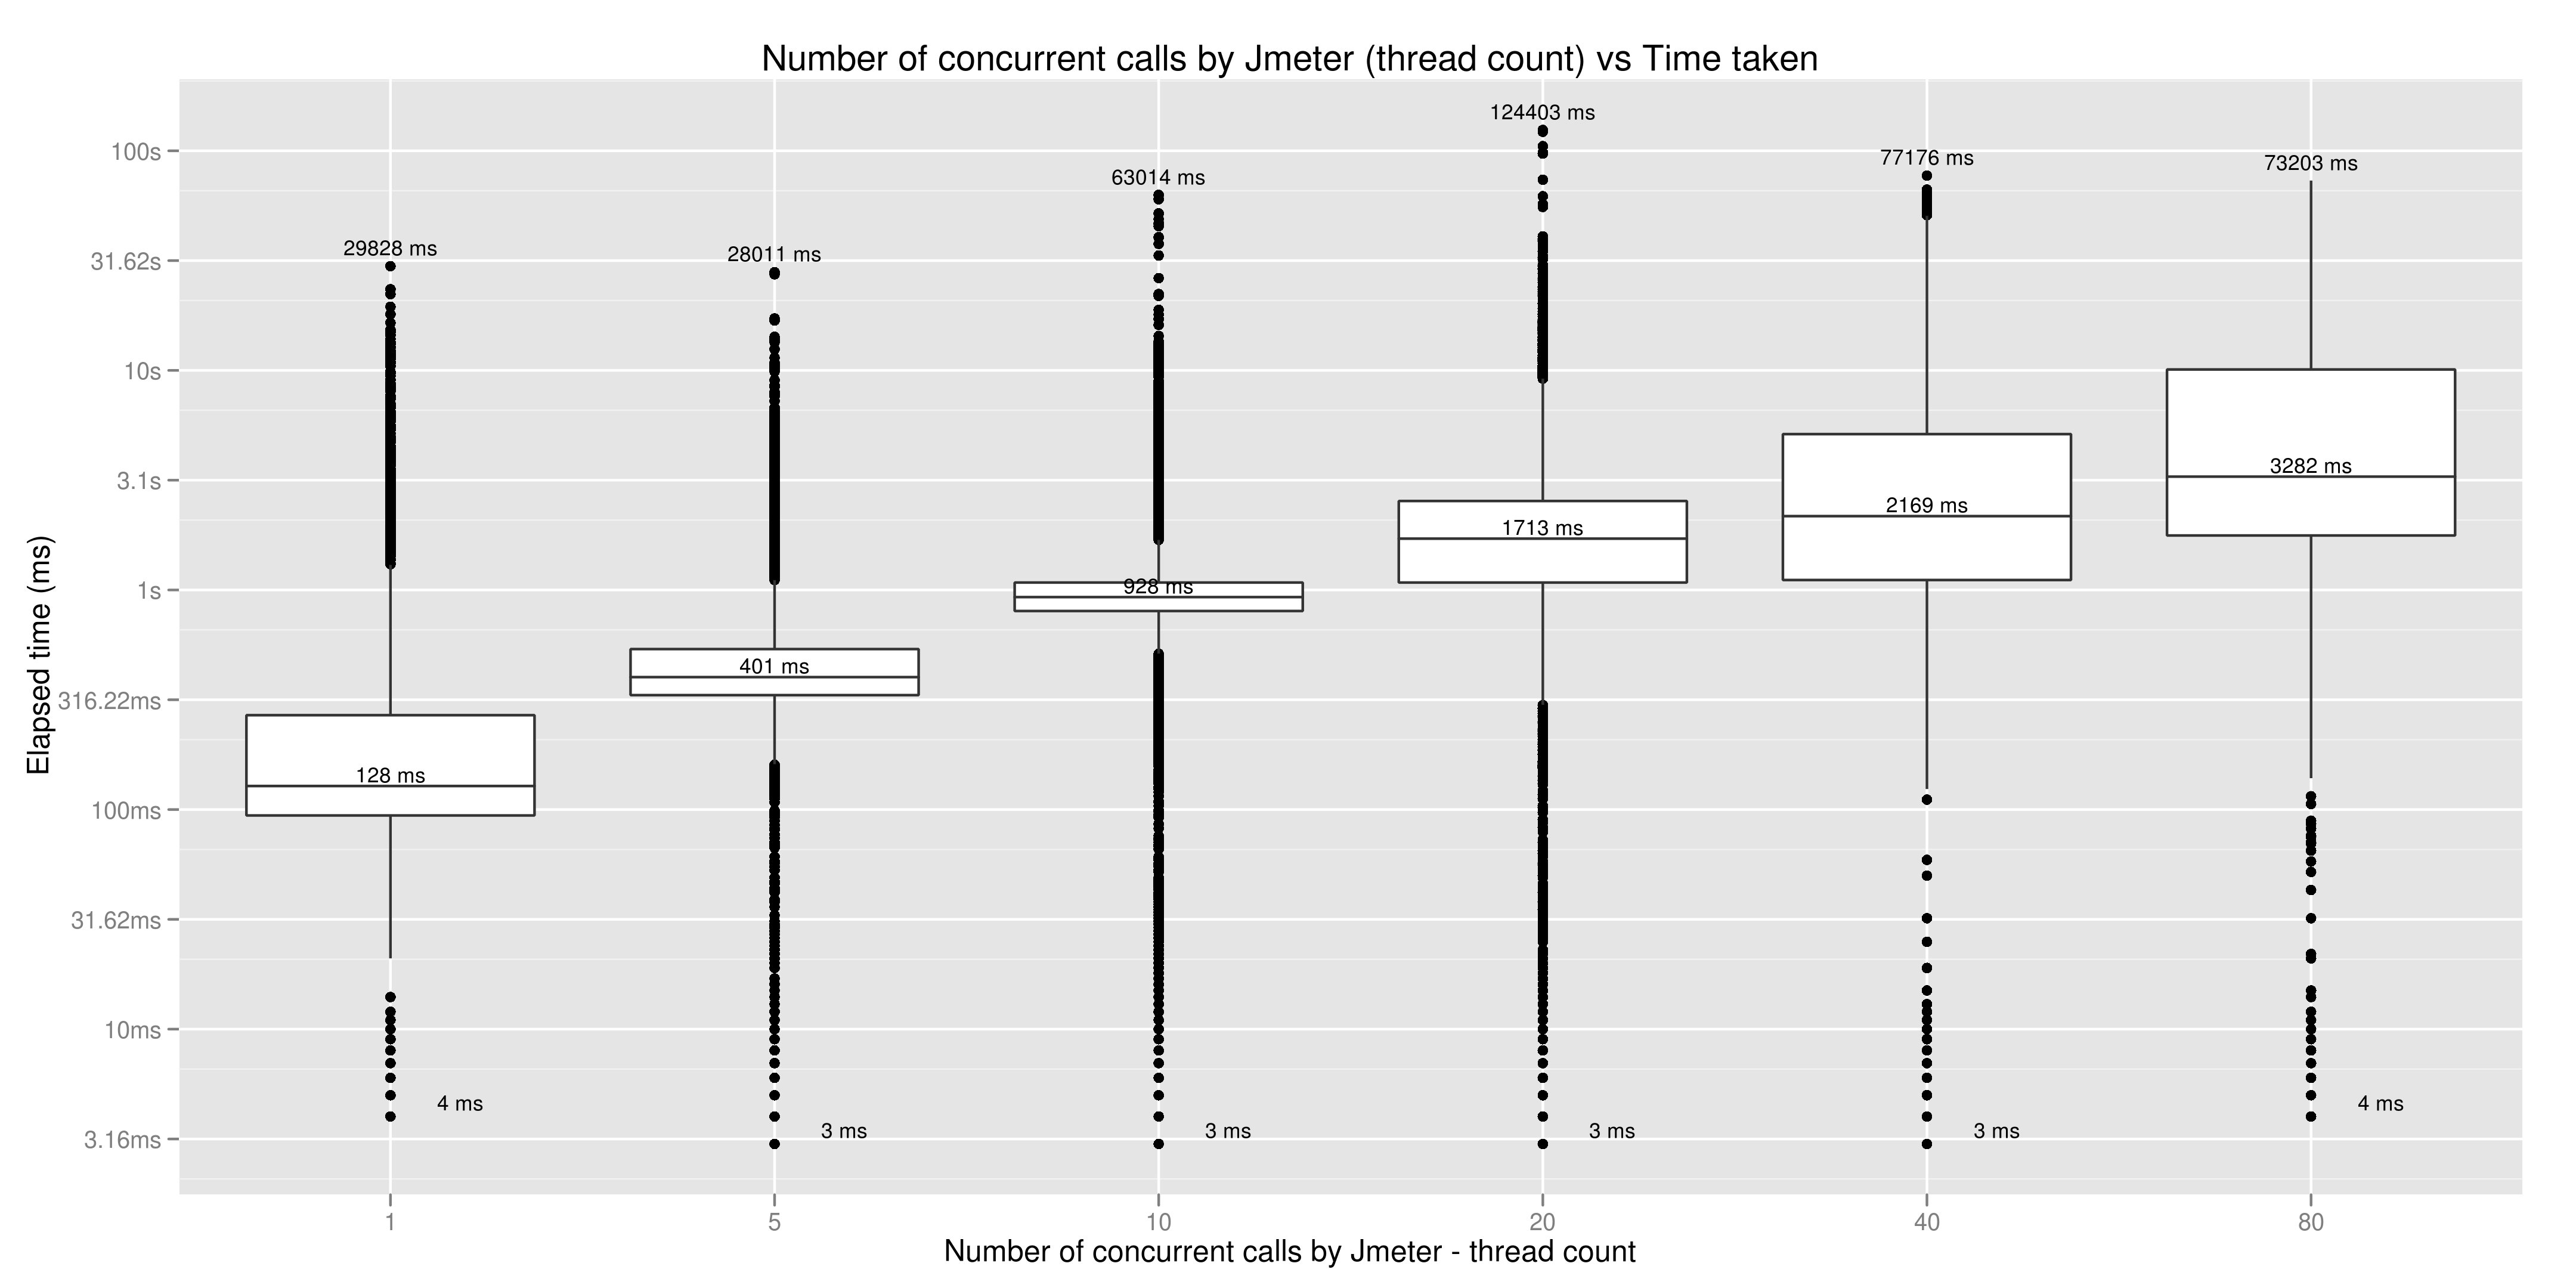
A box plot of Thread count vs Time taken to complete a response
- git source
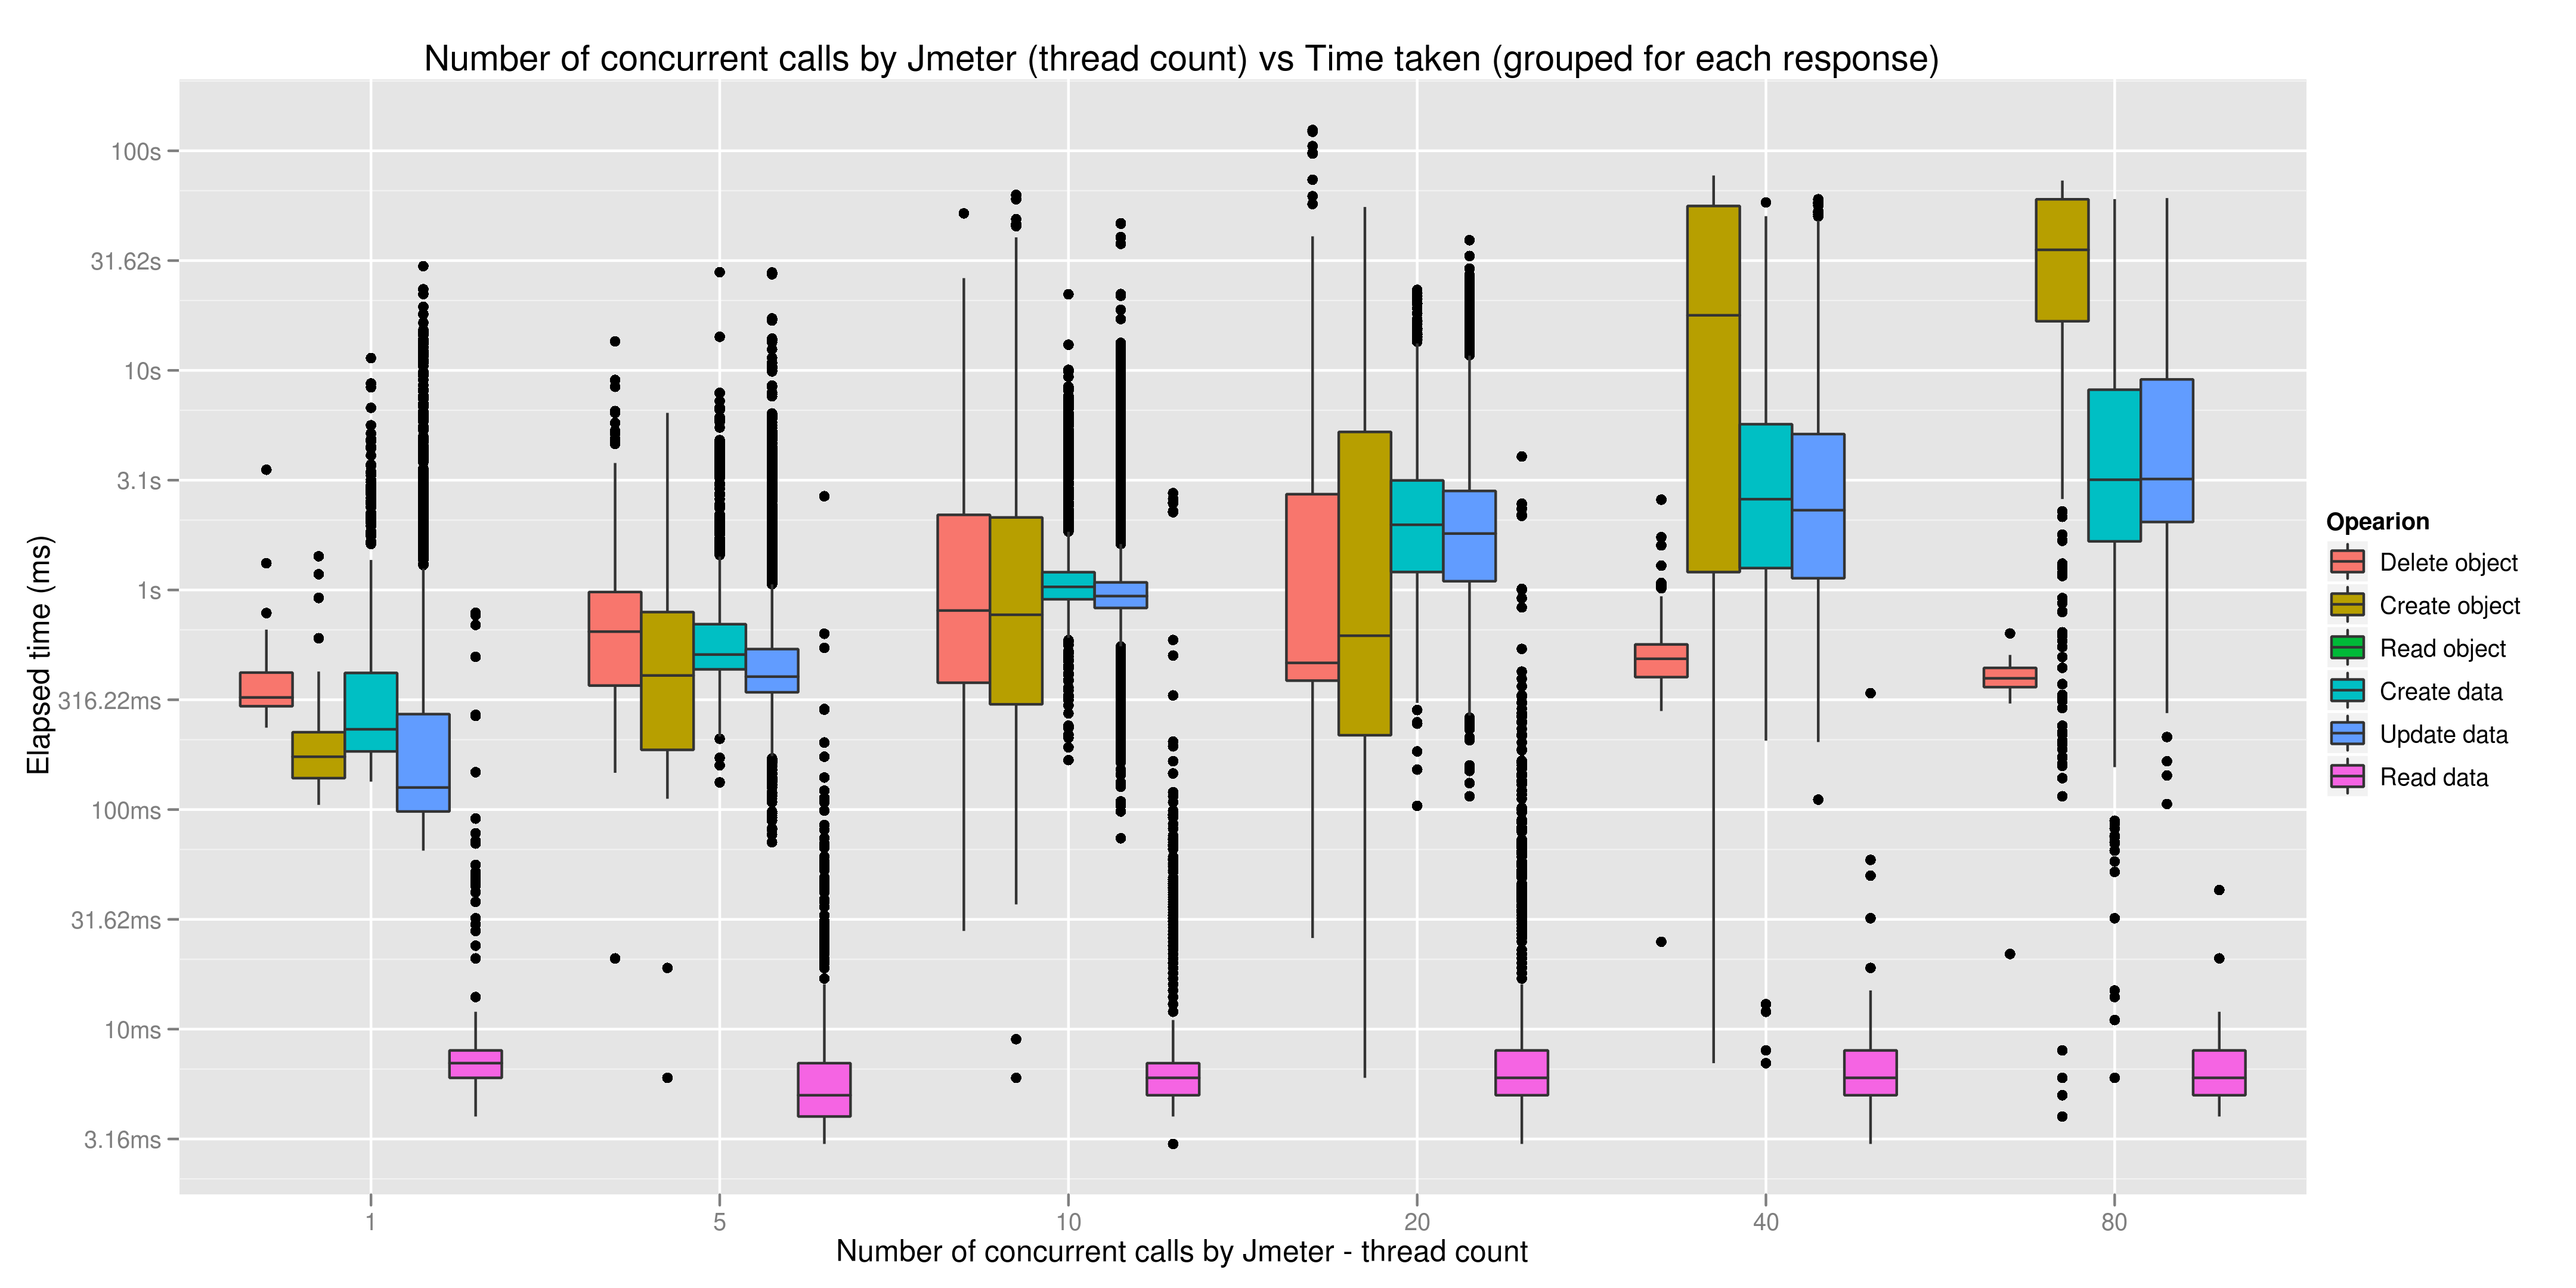
A box plot of Thread count vs Time taken to complete a response, for each of the operations
- git source
