Many VIVO implementers find collecting, mapping, and loading data into VIVO to be quite difficult. For example, data on publications, grants, and datasets produced by an institution’s faculty can be difficult to find and disambiguate. Understanding the ontologies used to describe data in VIVO and mapping faculty data to those ontologies involves a steep learning curve. Also, transforming the data to a linked data format, such as VIVO RDF, has proven difficult for most implementers due to gaps in skills and knowledge. These barriers have prevented organizations from joining the VIVO community and adopting the technology that enables access, discovery, and analysis of scholarship data.
Research Graph is an integrated network of information about researchers, their publications, grants, and datasets, across global research infrastructures such as ORCID, DataCite, CERN, CrossRef, and funders such as National Institutes of Health (NIH). At the time of writing this article, the Research Graph network connects more than thirty million research objects across Australia, Europe, United States and Japan.
For example, when provided “seed data,” such as a simple list of researchers, Research Graph will identify publications, grants, and/or datasets related to those researchers and represent the information in a graph. These are referred to as “first order” connections. Research Graph is also capable of identifying and linking collaborators of the people in the “first order” data and linking their publications, grants and datasets. These collaborator links are referred to as “second order” connections. We are not aware of any other technology or product, open source or proprietary, that can offer “second order” connections.
A recent collaboration between VIVO and Research Graph developed and demonstrated a repeatable process for using seed data to build first and second order graphs, and to export, transform, and load those graphs in VIVO RDF format to a hosted VIVO instance.
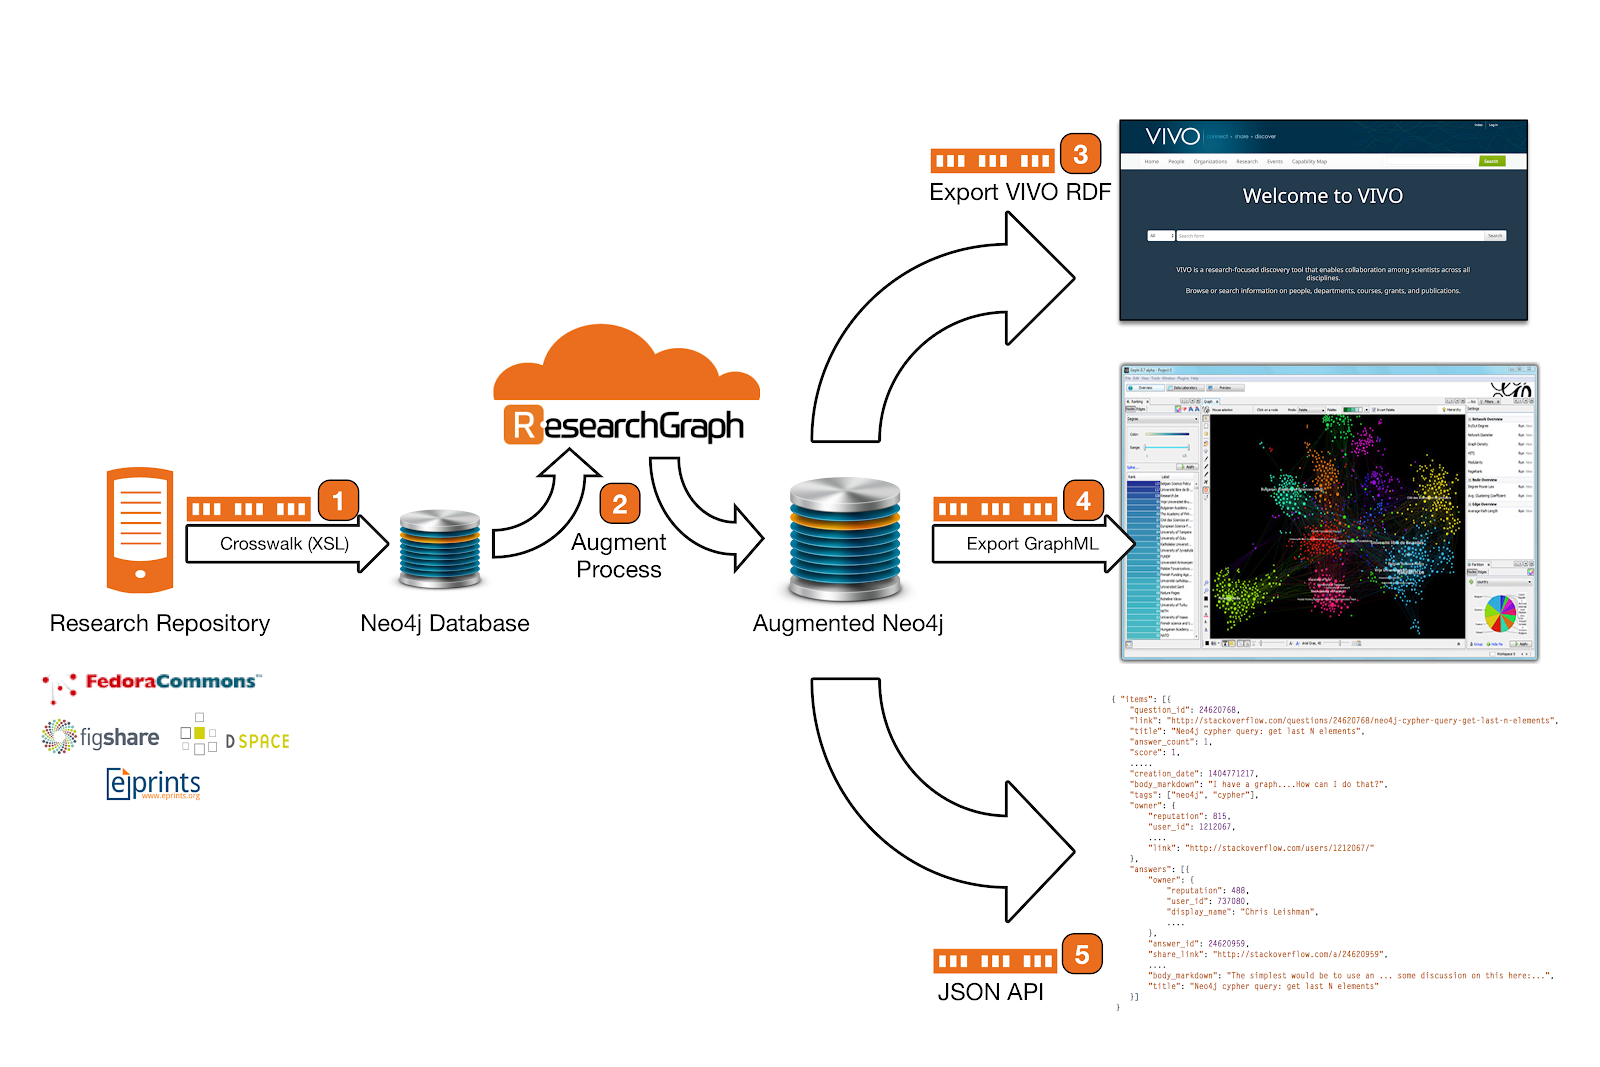
This process has been accomplished by using Research Graph. The outcome has the potential to resolve common difficulties experienced while finding, disambiguating, transforming, and mapping data for ingest into VIVO. As illustrated in the following figure, during this pilot we enrich the research repositories’ data by (1) Transforming repository data to a graph database, (2) Augmenting the graph with the Research Graph data, (3) Making this graph available as a VIVO instance. In addition, we make the graph data available as GraphML or JSON for further analysis and visualisation.
There are three types of organisations that can benefit from the collaboration between VIVO and Research Graph.
Type A (Repositories, Research Institutes): These institutions can benefit from transforming their seed data (people, and/or publications) to an augmented graph of people, publications, grants, and datasets. Furthermore, these institutions will benefit from the smooth transformation of their augmented graph to a VIVO instance with no requirement of high technical expertise.
Type B (Semantic Web Sites): Government and research organisations such as GeoScience Australia who already have their research data in RDF format can use VIVO as a data exchange platform between Research Graph and their semantic web system. Furthermore, these sites will be able to take advantage of VIVO visualisations of their collaboration network -- the capability that is often missing from their local RDF-based research system.
Type C (Current VIVO Sites): Using the connection between VIVO and Research Graph, these sites can enrich their data and ingest new information into their systems.
VIVO’s Project Director, Dr. Mike Conlon, Research Graph’s Director, Dr. Amir Aryani, and more recent collaborator, DuraSpace’s Business Development Manager, Erin Tripp propose a joint Research Graph VIVO Cloud Pilot project. It will investigate how a pilot organization can provide seed data and have the joint partners of the Cloud Pilot produce a fully populated, turn-key, hosted VIVO with linked researchers, publications, grants, and datasets that can be access and searched. A successful Cloud Pilot project will determine the value and potential of a long term collaboration between VIVO and Research Graph in the form of new services that could reduce barriers for organizations that want to implement VIVO.
Potential benefits of the Cloud Pilot include:
Development of a process for producing a turn-key hosted VIVO based on Research Graph data, significantly reducing the effort of new implementers
Production of linked data that could be used by the pilot organization for any purpose, including augmenting an existing VIVO, other research information, or data analysis systems
Opportunity for analysis by network researchers at pilot organizations to study the outputs related to specific research areas/efforts
Introducing Research Graph’s “second order” connections to the VIVO community. This provides not only the entities related to the seed data, but also entities related to the entities in the seed data. Second order data analysis can provide answers to questions such as “who do my collaborators collaborate with?” This is a tremendous advantage in the competitive landscape
Potential to greatly improve the adoption of VIVO, and grow the VIVO community
Development of technical automation to form the basis of services that can be provided to the VIVO community that supports the production of VIVO data and/or provides VIVO hosted software
An Expression of Interest (EOI) notice soliciting participation in a Research Graph VIVO Cloud Pilot was distributed at the Open Repositories conference in June 2017 as well as at the eResearch conference on October 2017, both located in Australia. The notice was also distributed to peers in Germany and Canada. Four organizations formally expressed interest in participation. Another five organizations informally expressed interest in participating..
The organizations that expressed interest in the Research Graph VIVO Cloud Pilot have varying levels of knowledge of the projects and technologies. The first phase will enable the Cloud Pilot Team to confirm what they consider to be the most important and unknown technical variable of the project, e.g. how large the seed data will grow after first and second level connections are made and what impact that will have on hosted server resources, cost, and performance.
The Cloud Pilot will also provide excellent information on scaling the service. Using subsets of Pilot Organization data, we can identify small to medium graph sizes. Using their entire faculty as seed data, we can load and scale test to large sizes. The organizations identified for the first phase of the Cloud Pilot are thought leaders in linked data, repositories, and the open science community. Their involvement lowers project risks and helps build understanding of a potential international service offering.
The following effort is estimated for the Pilot Team during the term: Market analysis and service definition lead (10%), Project manager (10%), VIVO subject matter expert (10%), Duraspace technical resource (20%), Research Graph subject matter expert (5%), and a Research Graph technical resource (20%). We recommend The Pilot Team meet with pilot organizations weekly during the term, forming the Cloud Pilot Working Group.
Footnotes:
Research Graph Home Page. http://researchgraph.org. Accessed December 2, 2017.
Conlon, Michael, and Amir Aryani. “Creating an Open Linked Data Model for Research Graph Using VIVO Ontology,” July 24, 2017. https://doi.org/10.4225/03/58ca600d726bd.