As of the Late Fall 2021 Work Cycle, Sinopia started tracking several metrics, accessible via the Actions dropdown menu. These metrics cover activity after October 2020.
As of 25 April 2002
| Environment | Total users (registered since or active since October 2020) | Users who created at least one resource (since October 2020) | Total number of resources (including those created before October 2020) | Total number of templates (including those created before October 2020) |
|---|---|---|---|---|
| Stage | 337 | 95 | 1941 | 663 |
| Production | 371 | 32 | 3512 | 752 |
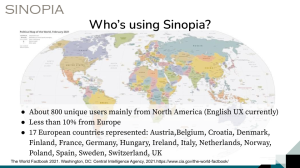
A few statistics generated for the 2021 BIBFRAME in Europe meeting:
The below user statistics reflect the number of users who signed up for an account in Sinopia's user management system, regardless of whether the user confirmed the account, logged in, or took any action in Sinopia. These statistics were based on registered users in Cognito (the user management system), which explains why the number of users shown may be larger than the above metrics obtained more recently from the Sinopia application itself.
As of 18 August 2021
- 596 unique users in production
- additional 240 unique users on stage and not on production
As of 18 August 2020
- 413 unique users in production
- 127 unique organizations represented by production users
- additional 171 unique users on stage and not on production
The below charts reflect users in production of 18 August 2020
|
|
