Fedora 4 is instrumented using Metrics. These metrics are exposed via JMX and an HTTP API. All REST API operations track timing and histogram information. Key internal API methods are also included. Modeshape and Infinispan include their own metrics reporting over JMX.
Here is an example metrics block:
 "org.fcrepo.api.FedoraLdp.createObject" : {
      "count" : 0,
      "max" : 0.0,
      "mean" : 0.0,
      "min" : 0.0,
      "p50" : 0.0,
      "p75" : 0.0,
      "p95" : 0.0,
      "p98" : 0.0,
      "p99" : 0.0,
      "p999" : 0.0,
      "stddev" : 0.0,
      "m15_rate" : 0.0,
      "m1_rate" : 0.0,
      "m5_rate" : 0.0,
      "mean_rate" : 0.0,
      "duration_units" : "seconds",
      "rate_units" : "calls/second"
    },
To enable Metrics reporting to JMX:
- Add "-Dcom.sun.management.jmxremote" to MAVEN_OPTS, e.g.:
export MAVEN_OPTS="-Xmx512m -XX:MaxPermSize=256m -Dcom.sun.management.jmxremote"
- Set the System Property "fcrepo.metrics.jmx" to "true", e.g.:
-Dfcrepo.metrics.jmx=true
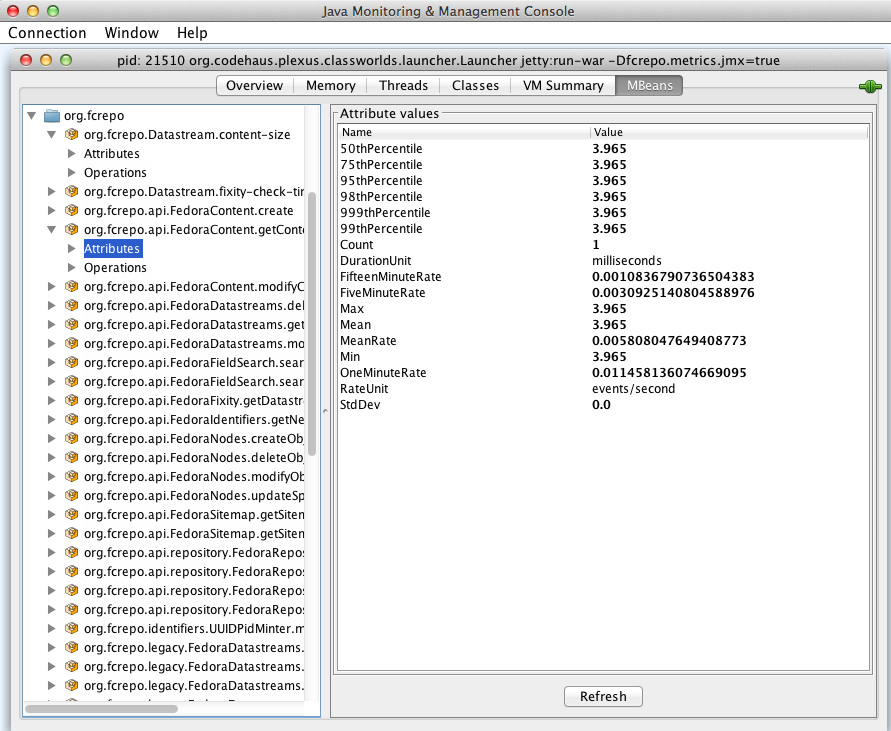
- Select the MBeans tab and navigate to "org.fcrepo"
The Metrics reporter can also be configured to report to Ganglia or Graphite to track and store data points over time. Fedora 4 ships with an example Graphite integration. See the documentation for setting up a Graphite locally or on Amazon EC2.