What are we testing?
The performance of Fedora 4 when performing create, read and delete operations of Fedora objects and datastreams using Fedora 4's REST API.
Test System
Fedora version 4 installed on futures6 (see Test Platform for details)
System information: systemInfo.txt has information about the system on which the tests were performed
- This was gathered using the script gatherSystemInfo.sh
Test Harness
See FF+Candidate+Test+Harness for information regarding the test harness, an explanation of the test results and analysing the test results
The test was done using Apache JMeter
The Jmeter script used for the test is Fedora.jmx published in the github repo ff-jmeter-madness
- With the Fedora 3 tests disabled - Fedora 3 Describe, Delete Fedora 3 Existing Objects, Fedora 3 thread group (testing Fedora4 only)
- Version of Fedora.jmx with the Fedora3 tests disabled
This was run from Futures1
The test script fedora4Test.sh was used to execute the test code with the different test parameters - file size and thread count
The test scripts, results and the graphs generated are available on github at https://github.com/futures/ff-jmeter-testResults/tree/master/2013-04-25-Fedora4Tests
Test Parameters
Number of Threads: The number of concurrent requests Jmeter will generate, when executing the tests
Number of Loops: Configures the number of datastreams in the fedora object
File size mean and standard deviation - Used to produce random binary data, from the stable set of file sizes
| Parameter | Values | ||||||||||
|---|---|---|---|---|---|---|---|---|---|---|---|
| Number of threads | 1 | 5 | 10 | 20 | 40 | 80 | |||||
| Number of loops | 10 | ||||||||||
| File size - Mean (bytes) | 1 (1B) | 1024 (1kB) | 8192 (8kB) | 104858 (0.1MB) | 1048576 (1MB) | 8388608 (8MB) | 107374182 (100MB) | ||||
File size - Standard deviation | 0.1 | 102 | 819 | 10486 | 104858 | 838861 | 10737418 | ||||
The binary data created during the test run, is used as the data for datastreams, in the creation and modification of the datastreams within an object. The size of the binary data is based on the test parameters of mean and standard deviation.
Test Results
- The test was run a total of 42 times (6 values of thread count and 7 values of file size)
- The results are logged to csv files and have been placed in the log directory
- Graphs were generated using R for statistical computing and graphics
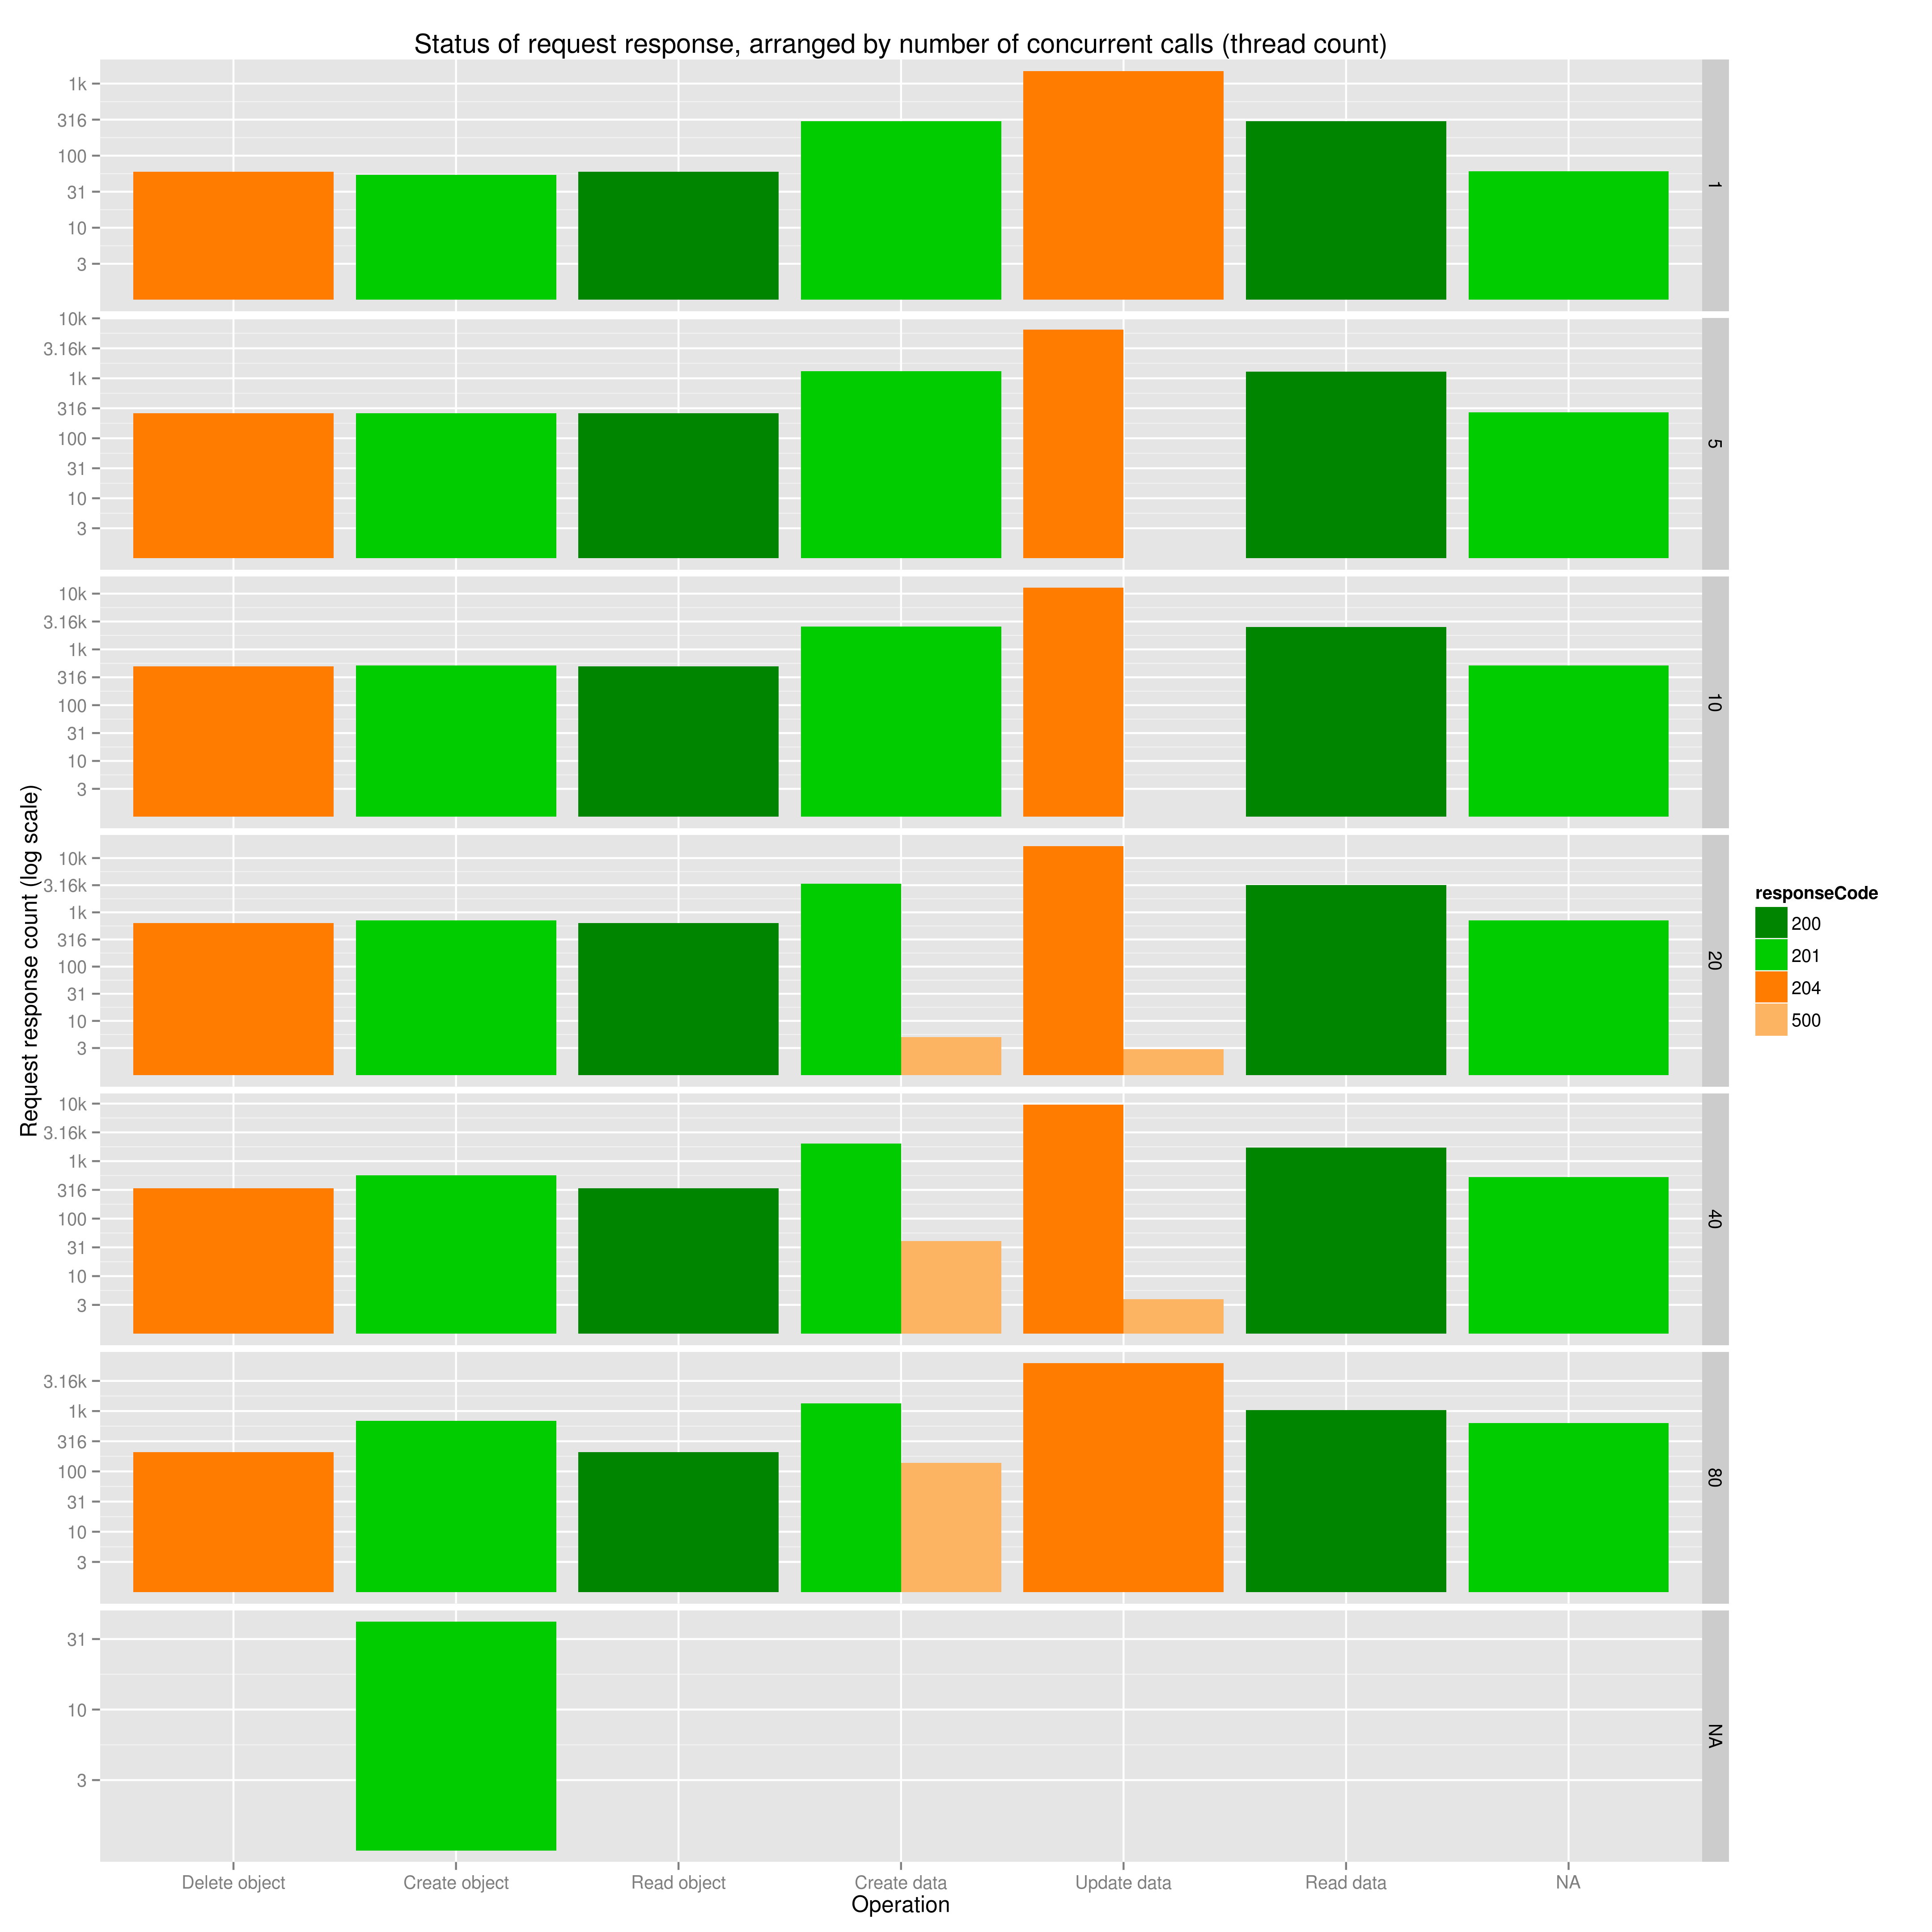
A stacked bar chart of the different response codes received, grouped by thread count
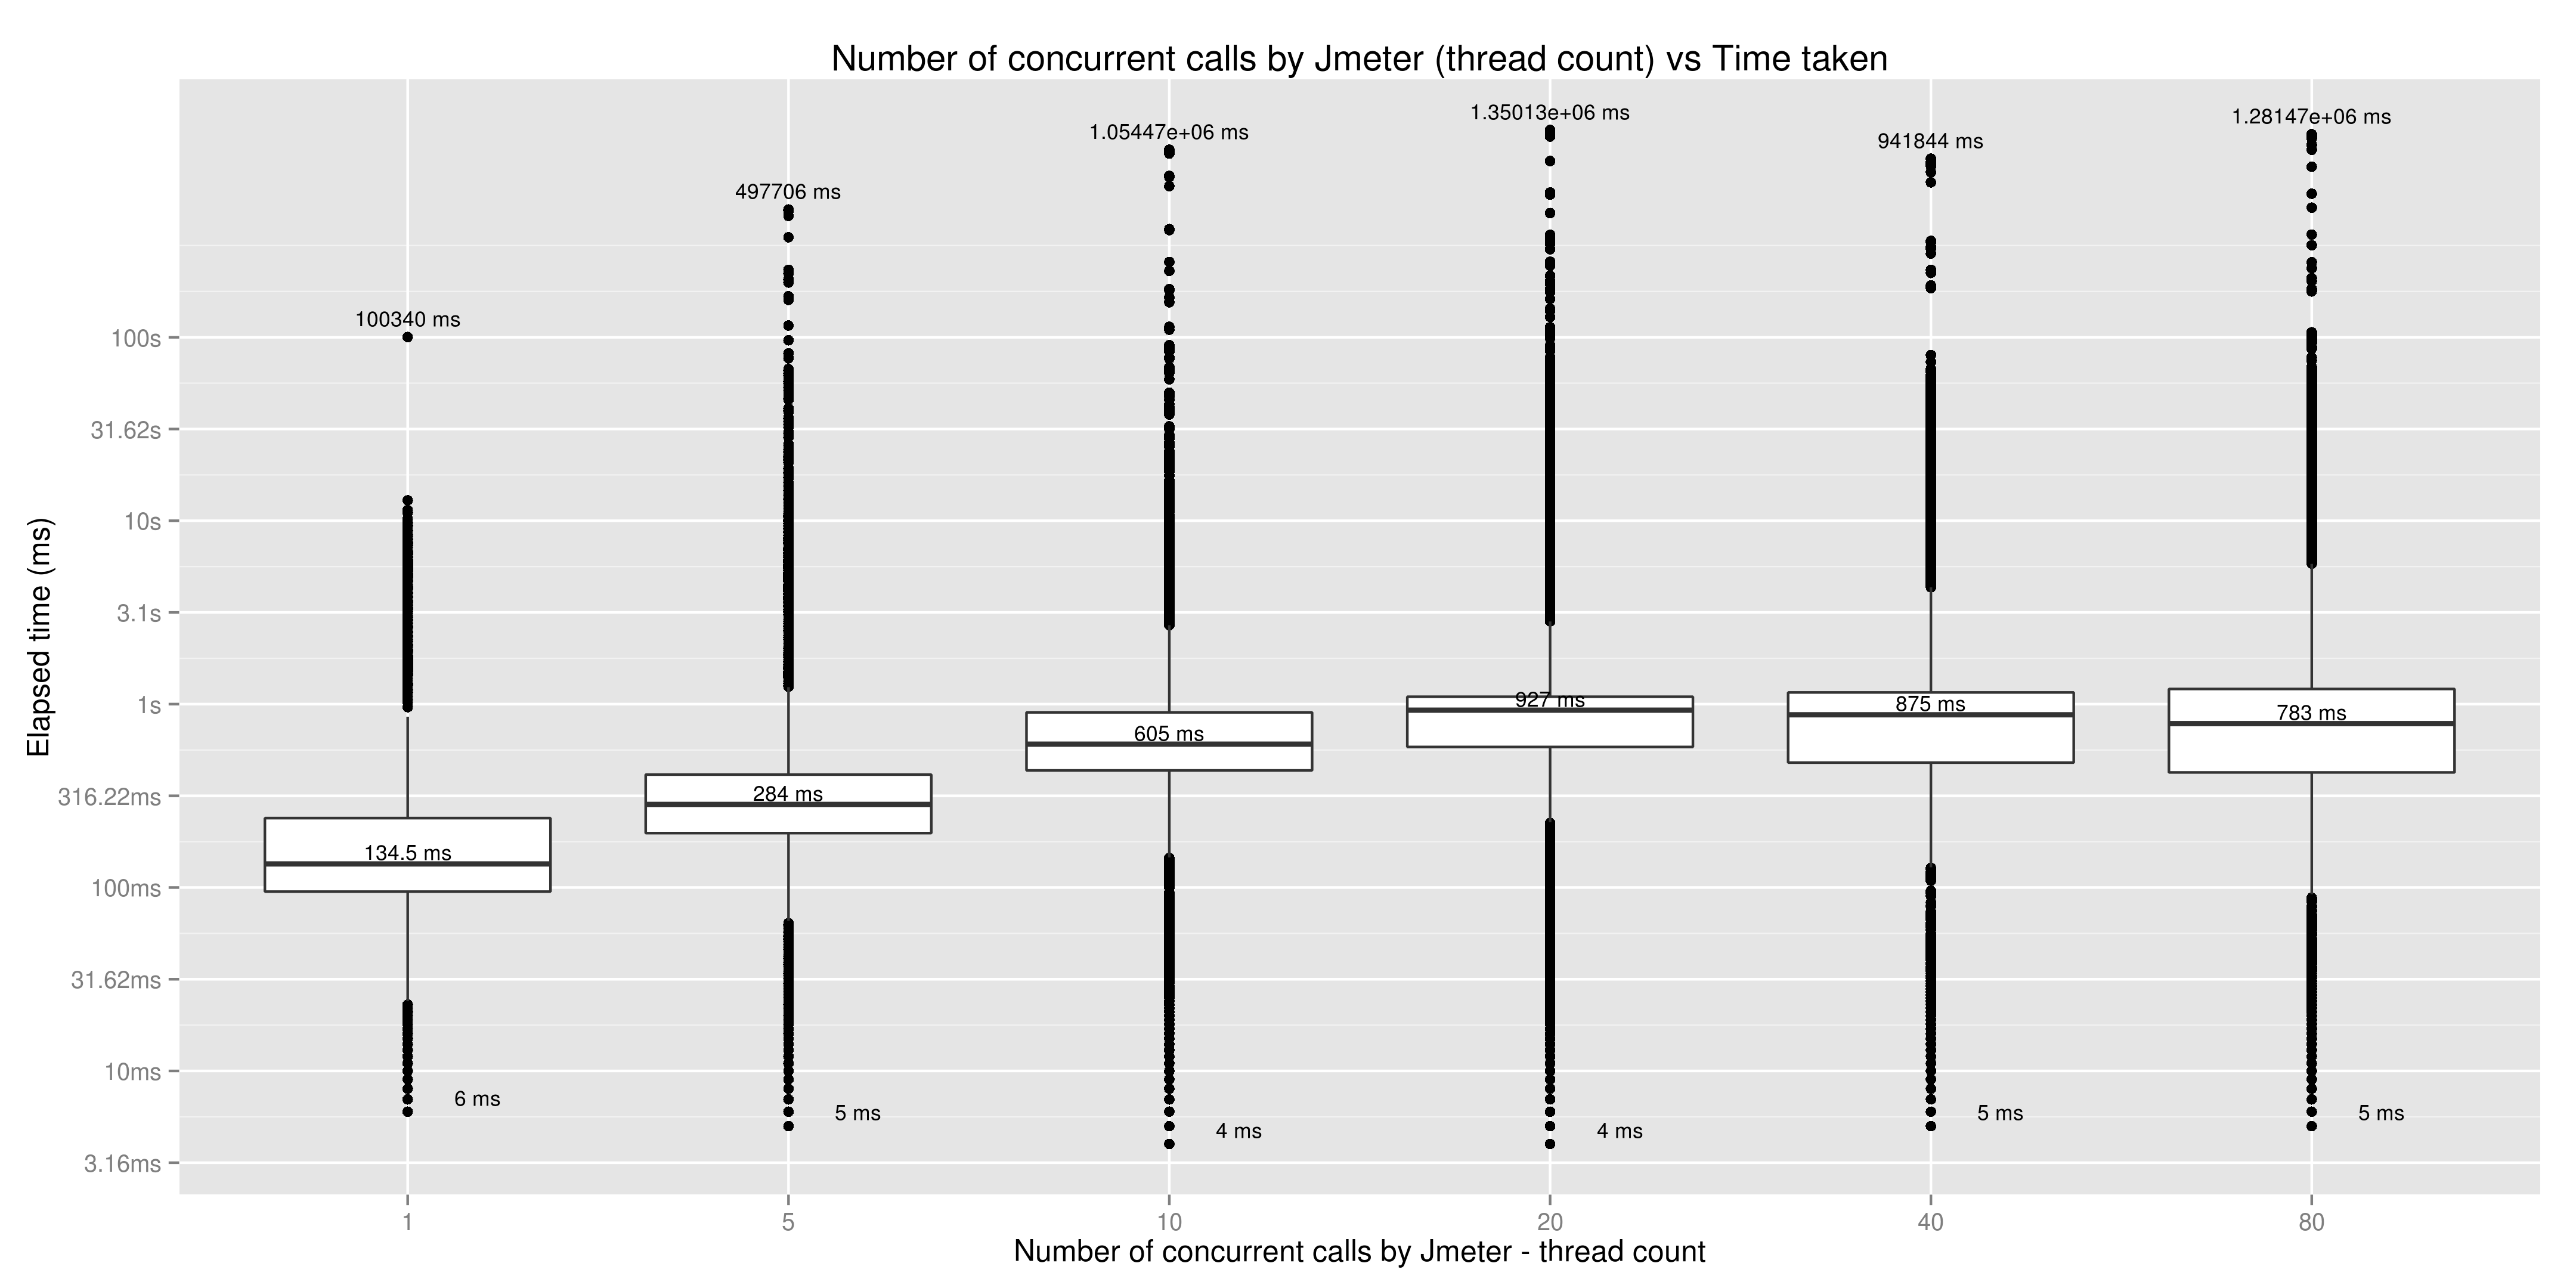
A box plot of Thread count vs Time taken to complete a response
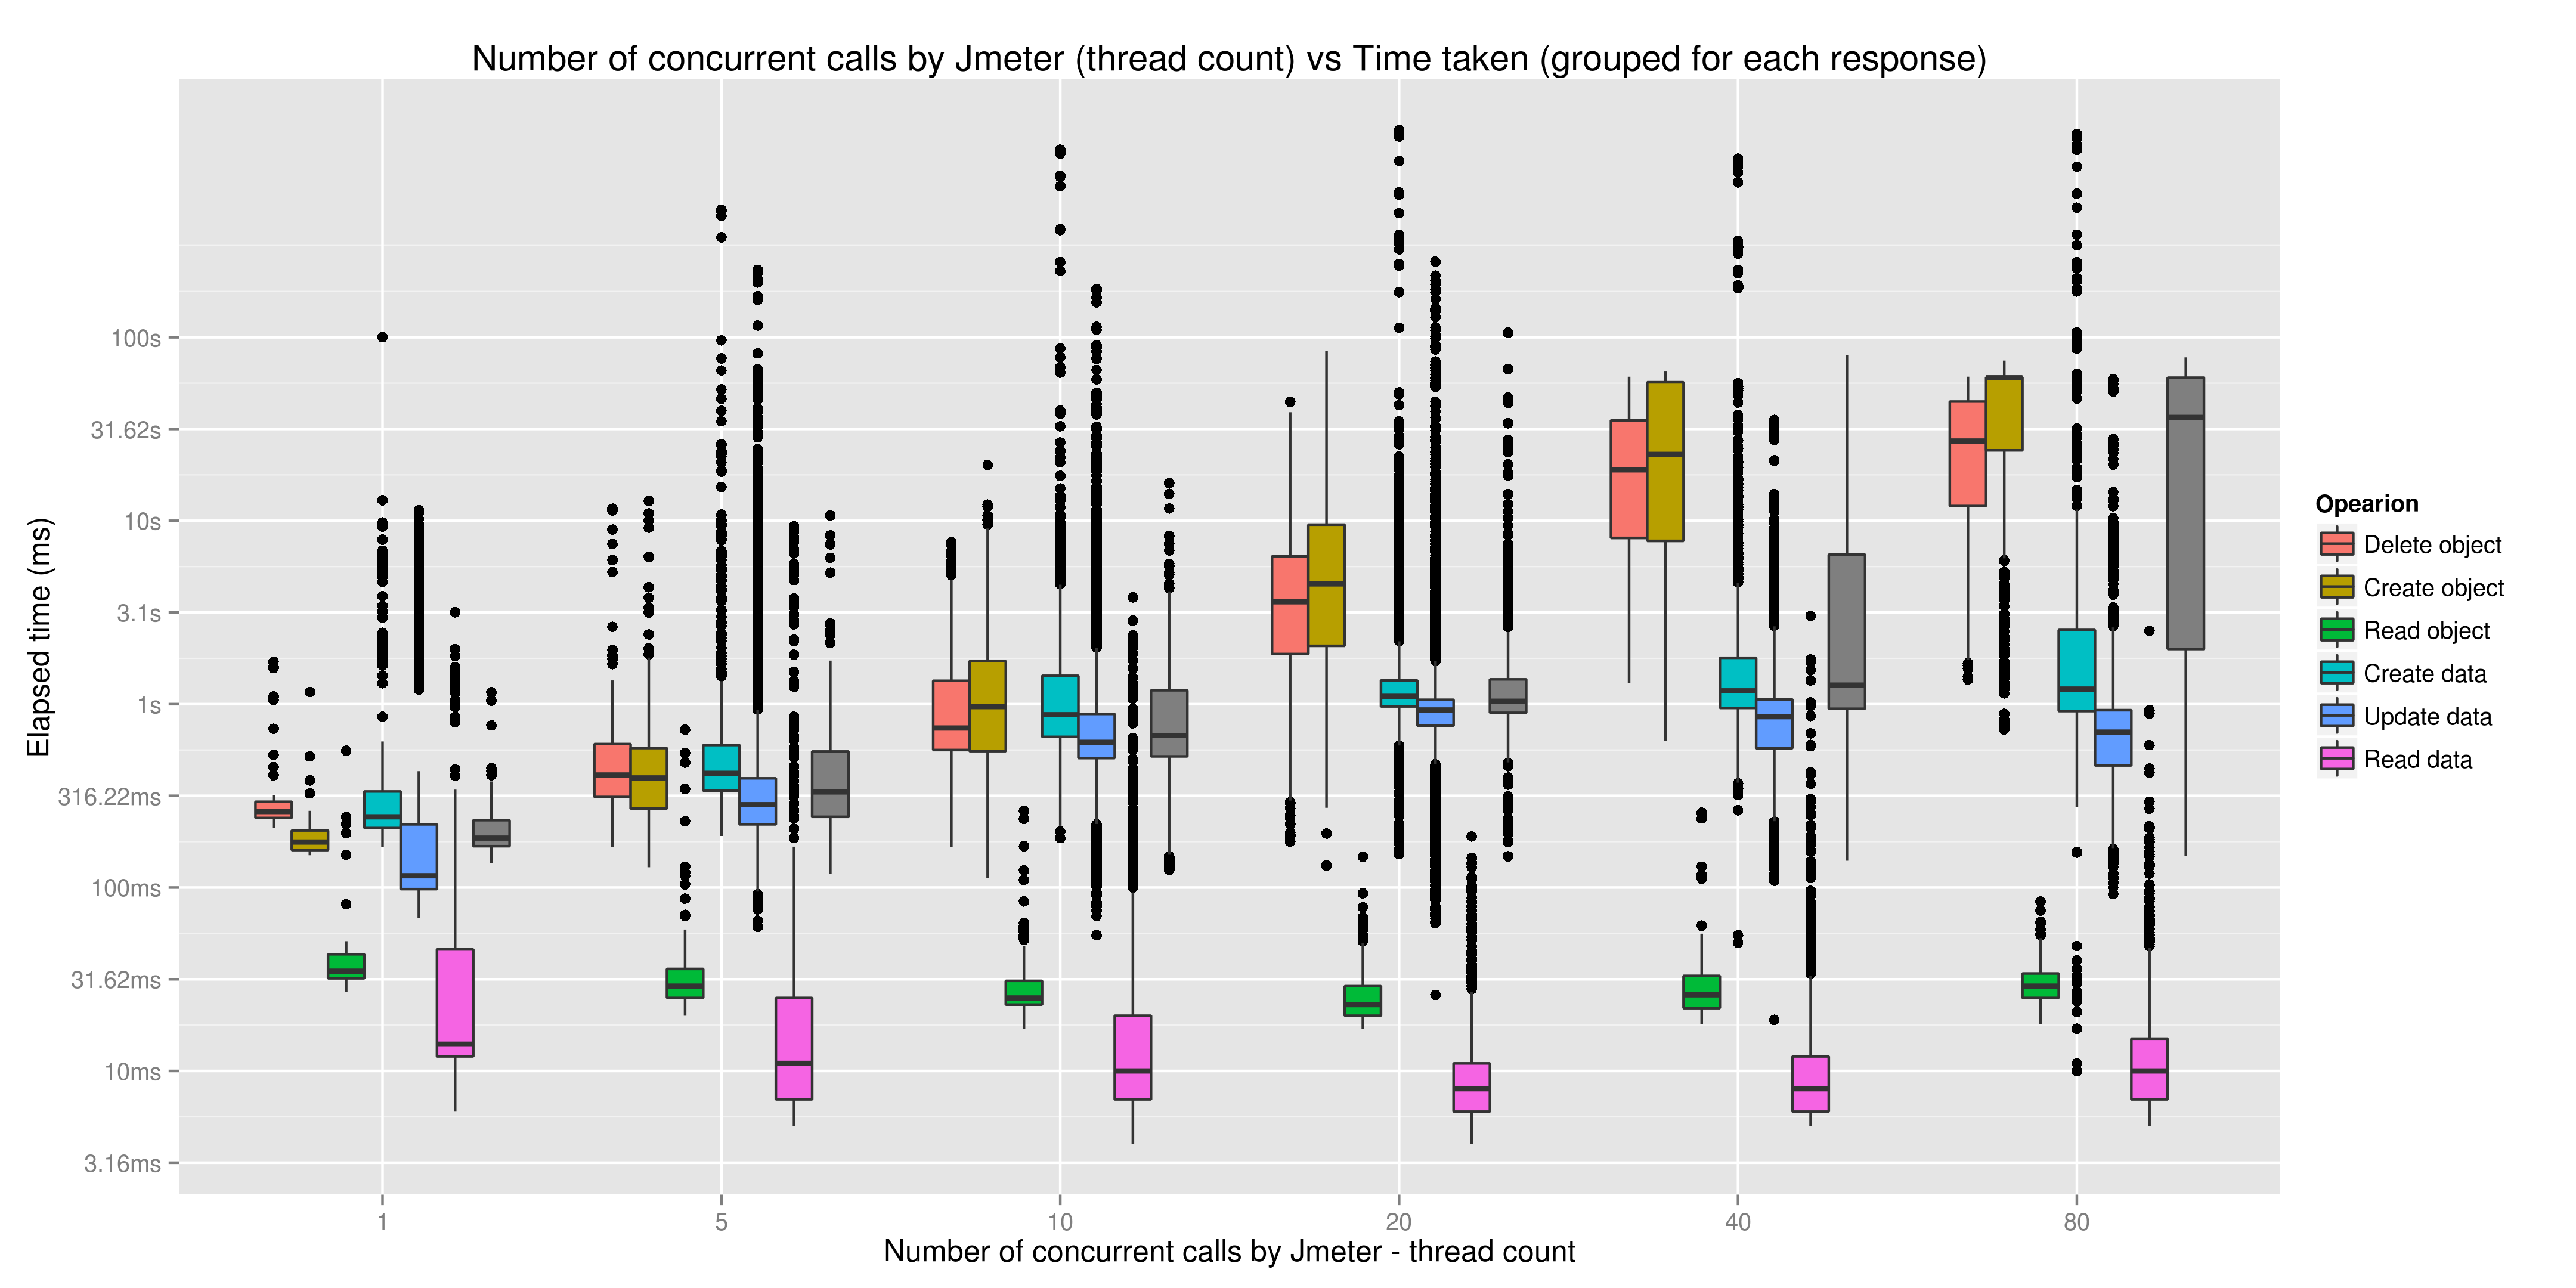
A box plot of Thread count vs Time taken to complete a response, for each of the operations
Analysing the test results
The stats visualizations were done using R (http://www.r-project.org/).
The code used to produce the graphs is in fedora-jmx.r.
...
- The test results were copied from futures6 /opt/ff-jmeter-madness/log to a machine where R is installed
...