...
Test System
Fedora version: 3.6.2 installed on futures6 (see Test Platform for details)
System information: The systemInfo.txt has information about the system on which the tests were done is placed at systemInfo.txtperformed
- This was gathered using the script gatherSystemInfo.sh
...
The Jmeter script used for the test is Fedora.jmx published in the github repo ff-jmeter-madnessGithub is also used to publicize and keep track of the outcome of the test results at ff-jmeter-testResults - 2013-02-01-FedoraTests
This was run from Futures1
The test script fedoraTest.sh was used to execute the test code with the different test parameters - file size and thread count
Test Parameters
Number of Threads: The number of threads concurrent requests Jmeter will use to execute the testgenerate, when executing the tests
Number of Loops: Configures the number of datastreams in the fedora object
File size - A set of files are generated on the fly. The file size is based on the mean and standard deviationmean and standard deviation - Used to produce random binary data, from the stable set of file sizes
Test Data
| Parameter | Values | |||||||||||||||||
|---|---|---|---|---|---|---|---|---|---|---|---|---|---|---|---|---|---|---|
| Number of threads | 1 | 5 | 10 | 20 | 40 | 80 | 160 | |||||||||||
| Number of loops | 10 | |||||||||||||||||
| File size - Mean (bytes) | 1 | 1024 (1k) | 8192 (8k) | 104858 (10k) | 1048576 (0.1M) | 8388608 | 107374182 | File size - Standard deviation (bytes) | ||||||||||
| 0 | 102 | 819 | 10486 | 104858 | 838861 | 10737418 | ||||||||||||
Test Results
- The test was run a total of 14 35 times (7 values of file sizes thread count and two 5 values of thread countfile size)
- The results are logged to csv files and have been placed in the log directory
- Graphs were generated using R for statistical computing and graphics
Analyzing the test results
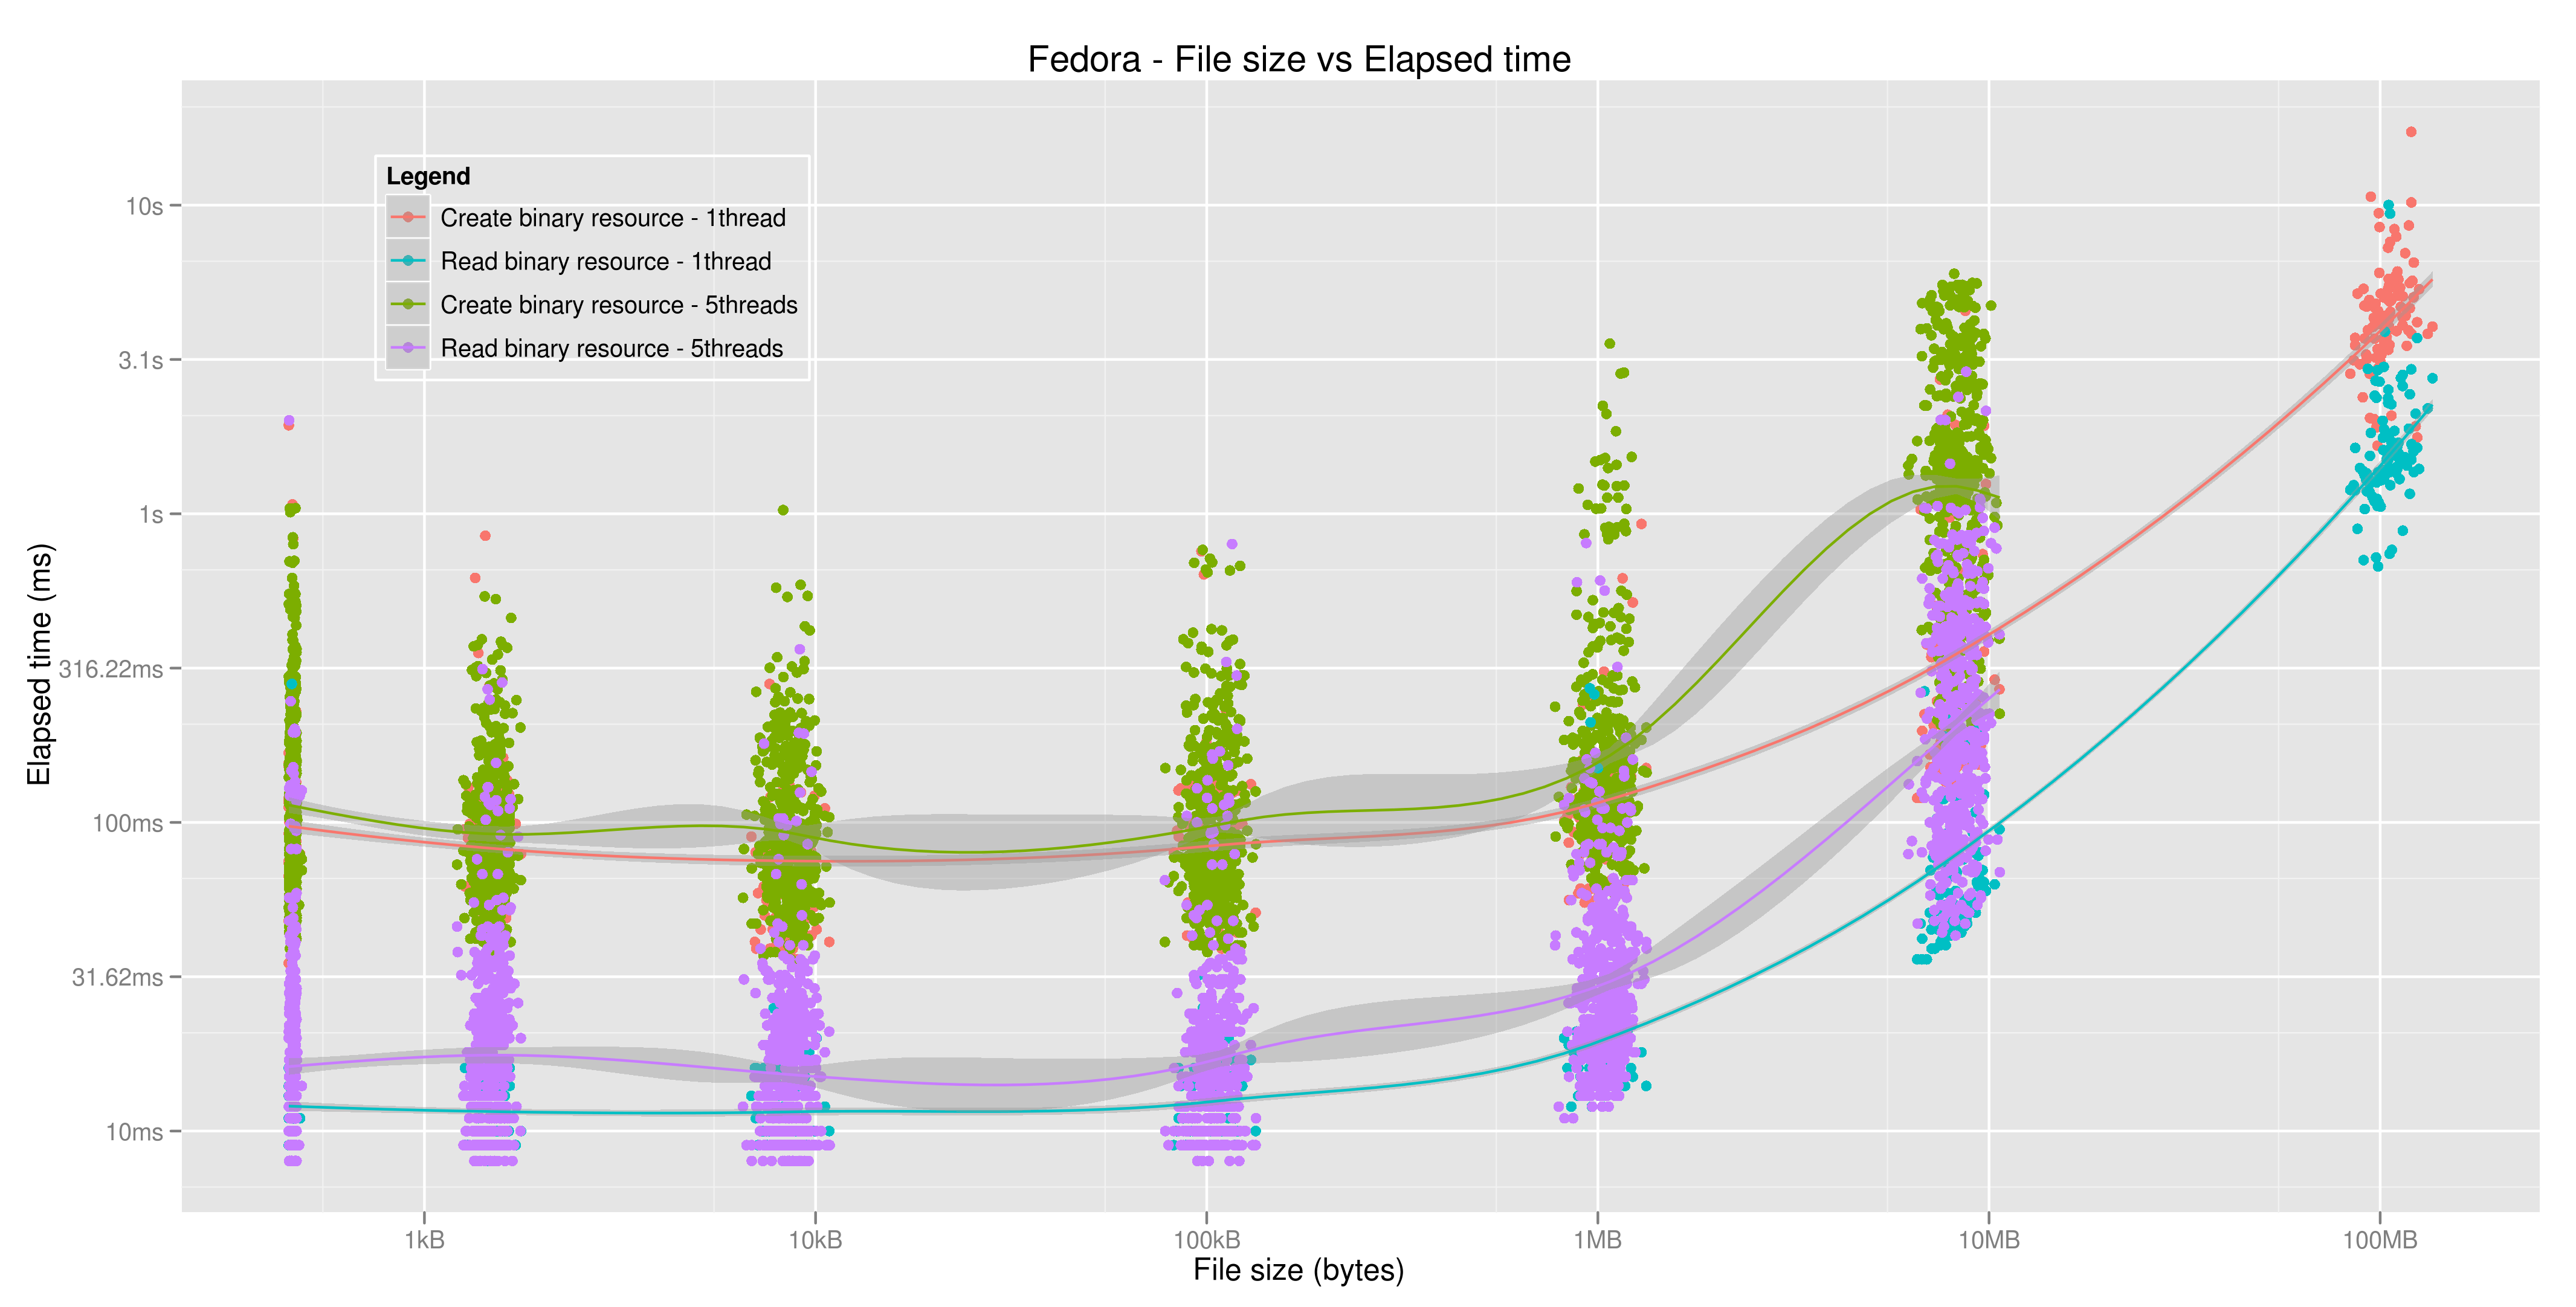
A plot of file size v/s elapsed time - testing the time taken to create a datastream (of differing file sizes) for 1 and 5 threads plotted individually and a combined plot
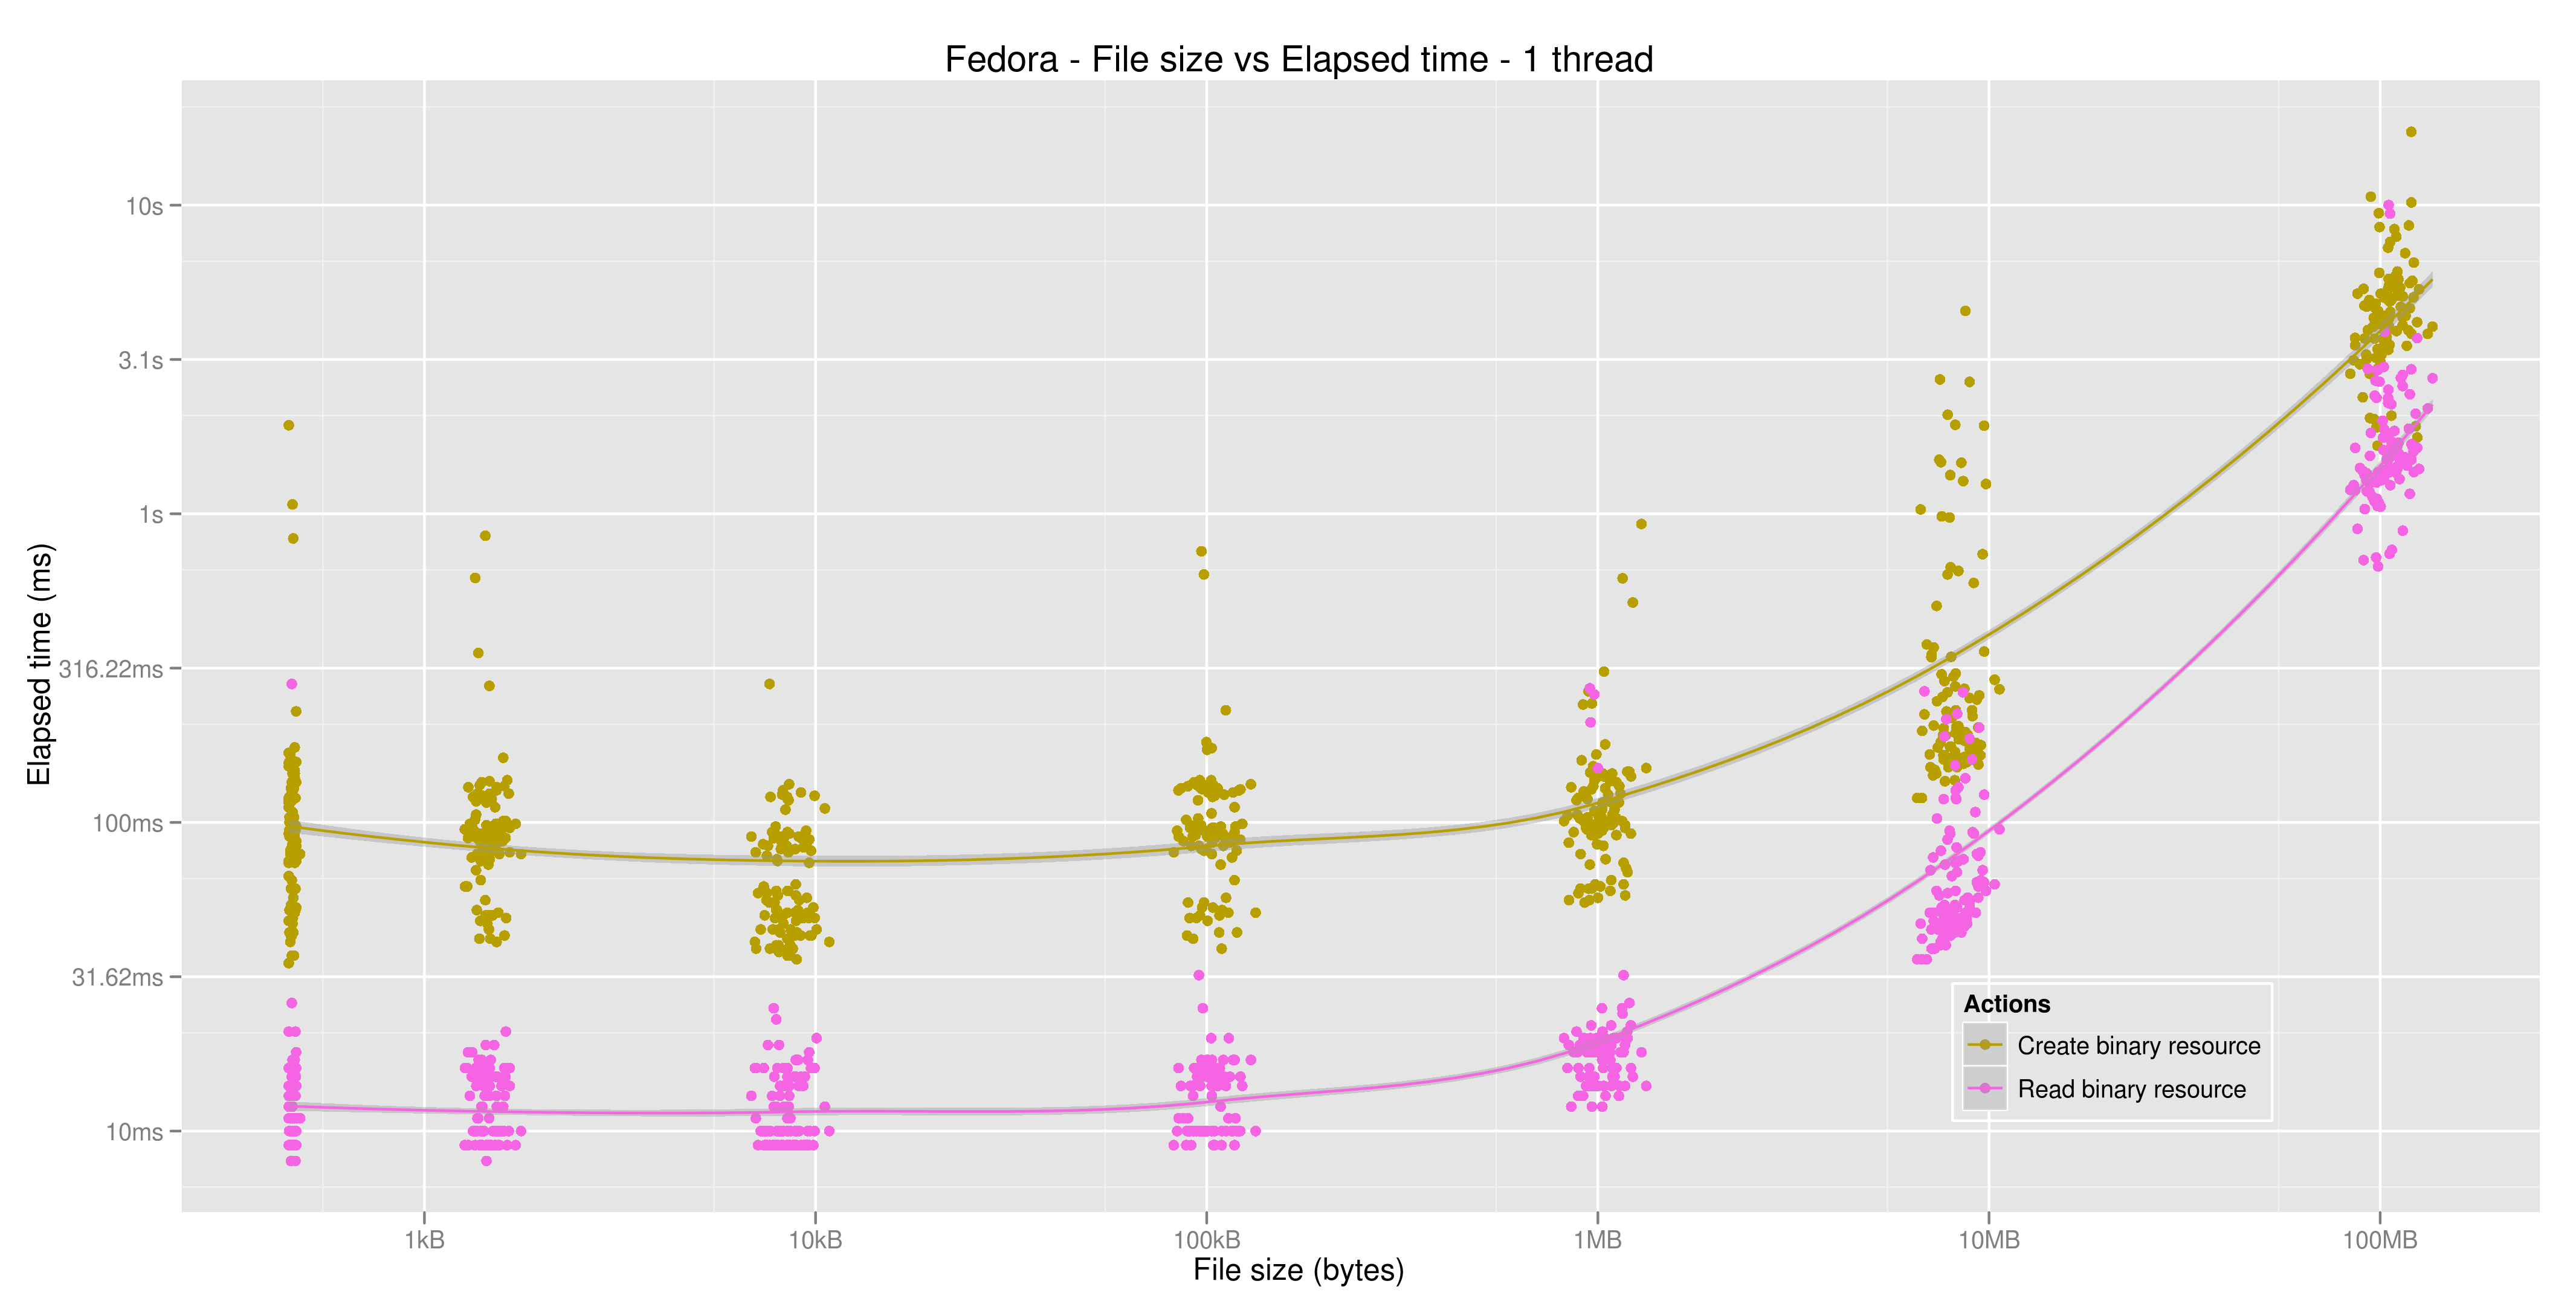
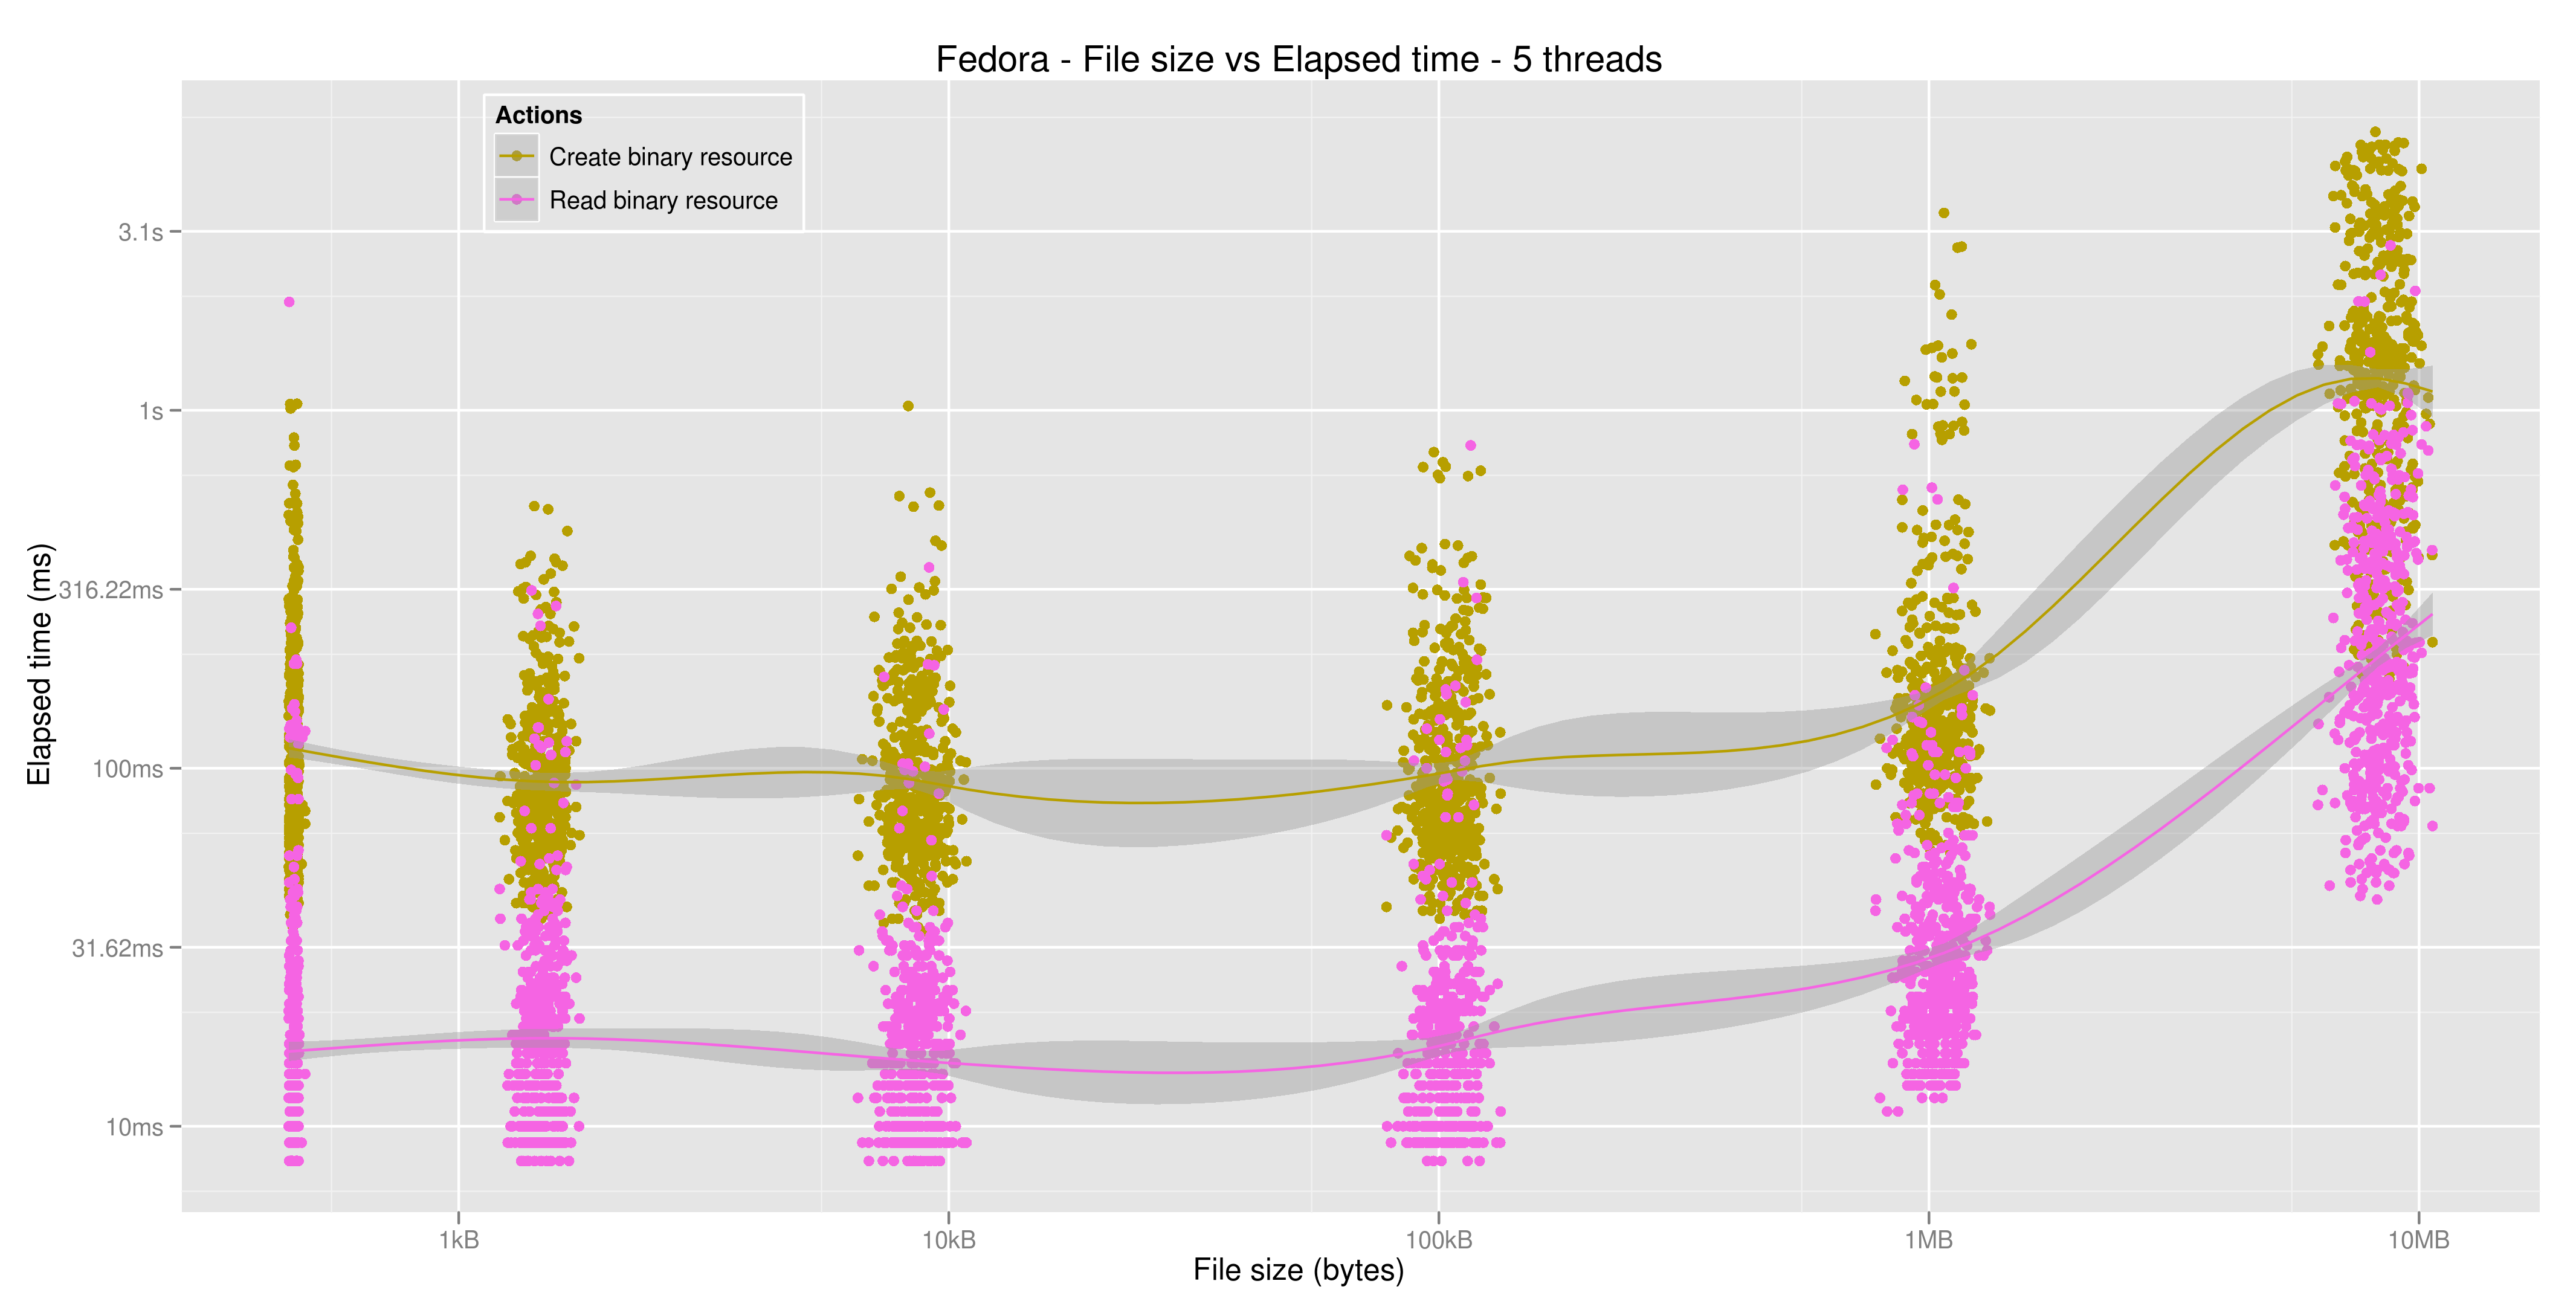
A plot of file size v/s time taken to transfer each byte - (shows the system latency, especially seen with files of size < 1 MB) for 1 and 5 threads plotted individually and a combined plot
A plot of file size v/s number of bytes transferred in 1 ms - (inverse of the above plots) for 1 and 5 threads plotted individually and a combined plot
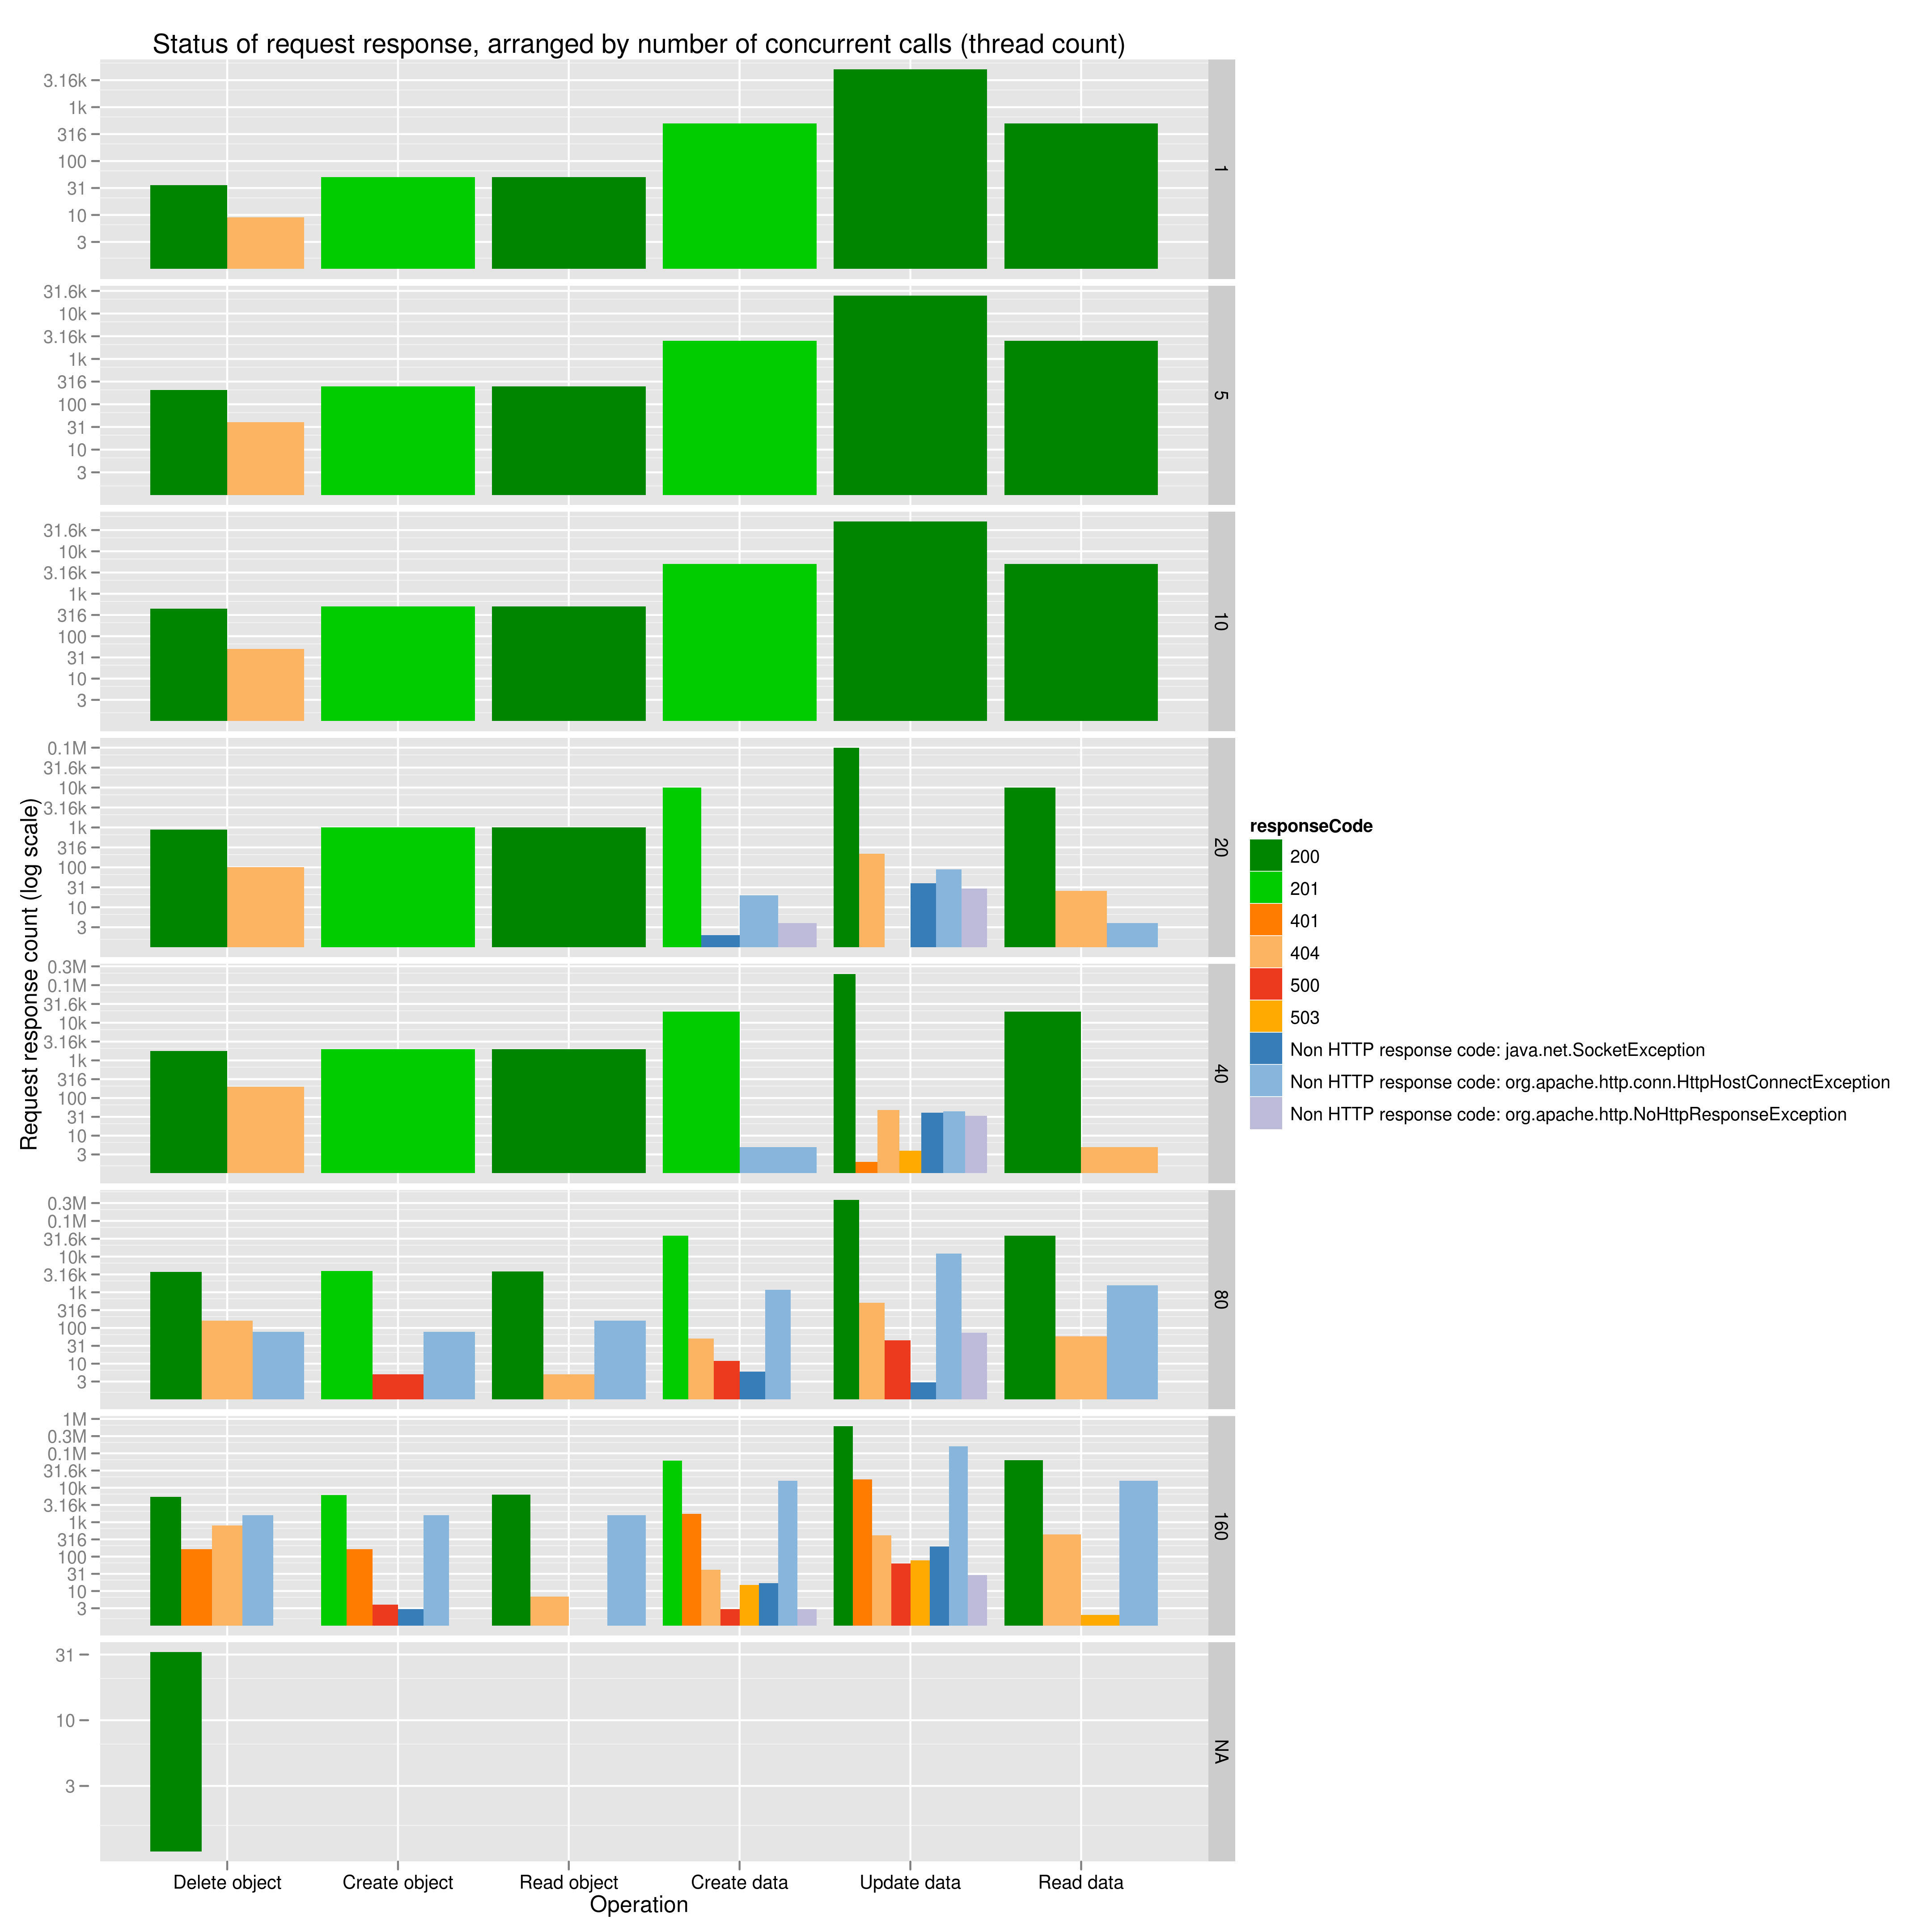
A stacked bar chart of the different response codes received, grouped by thread count
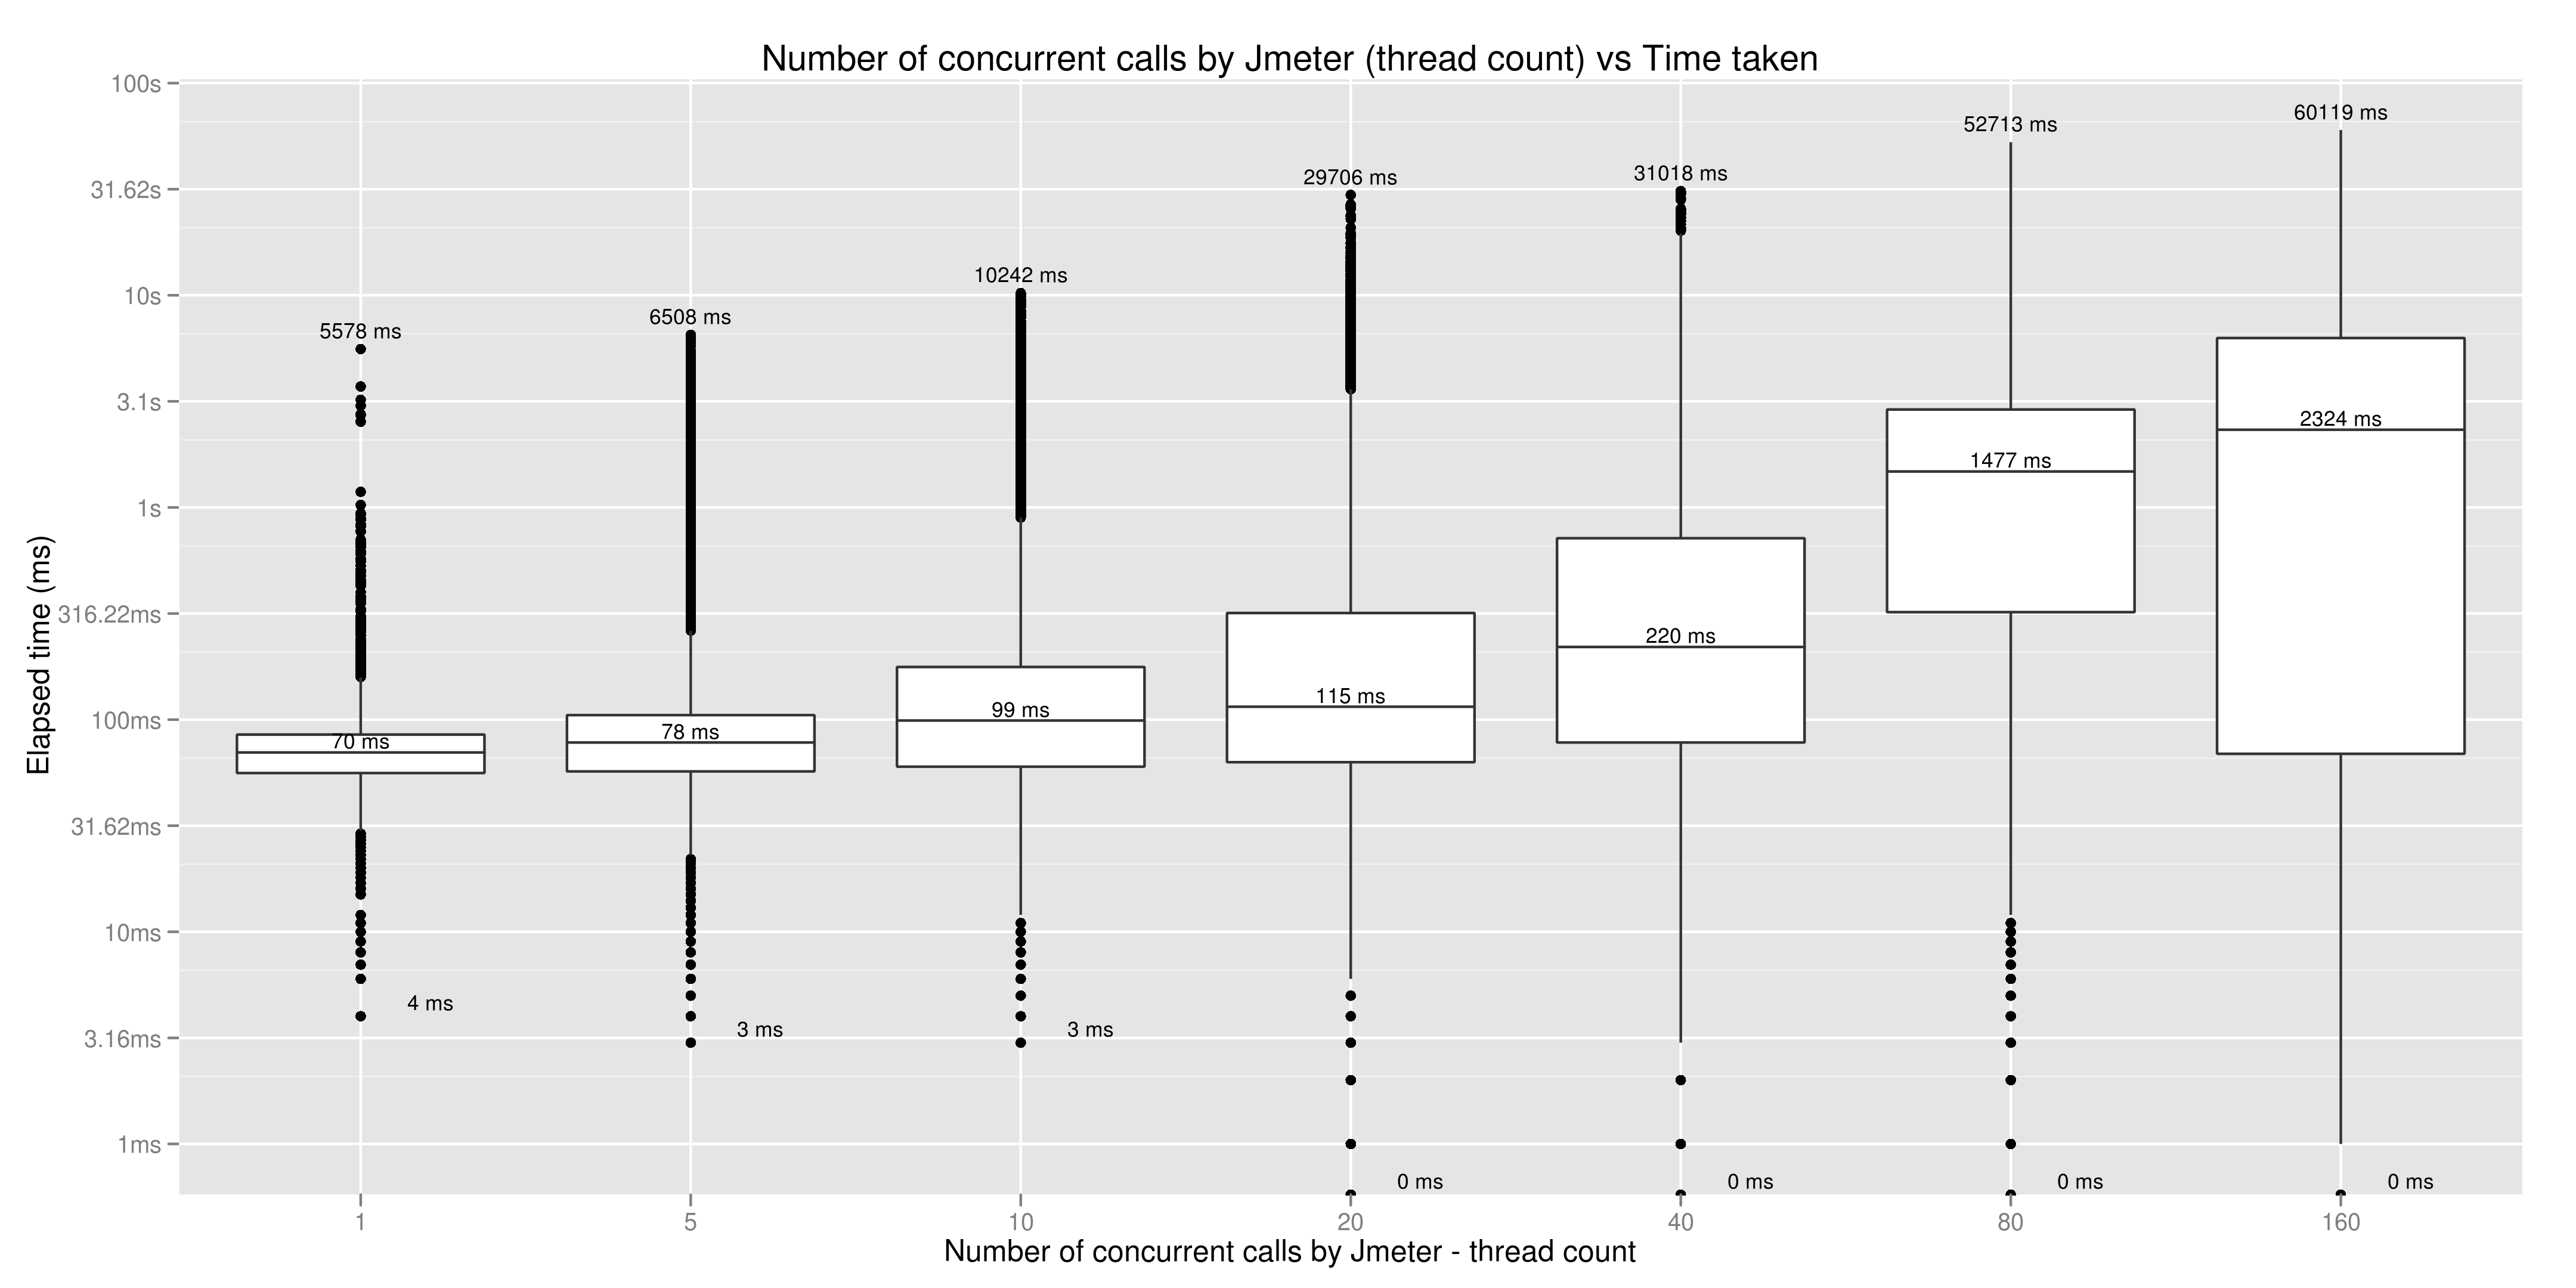
A box plot of Thread count vs Time taken to complete a response
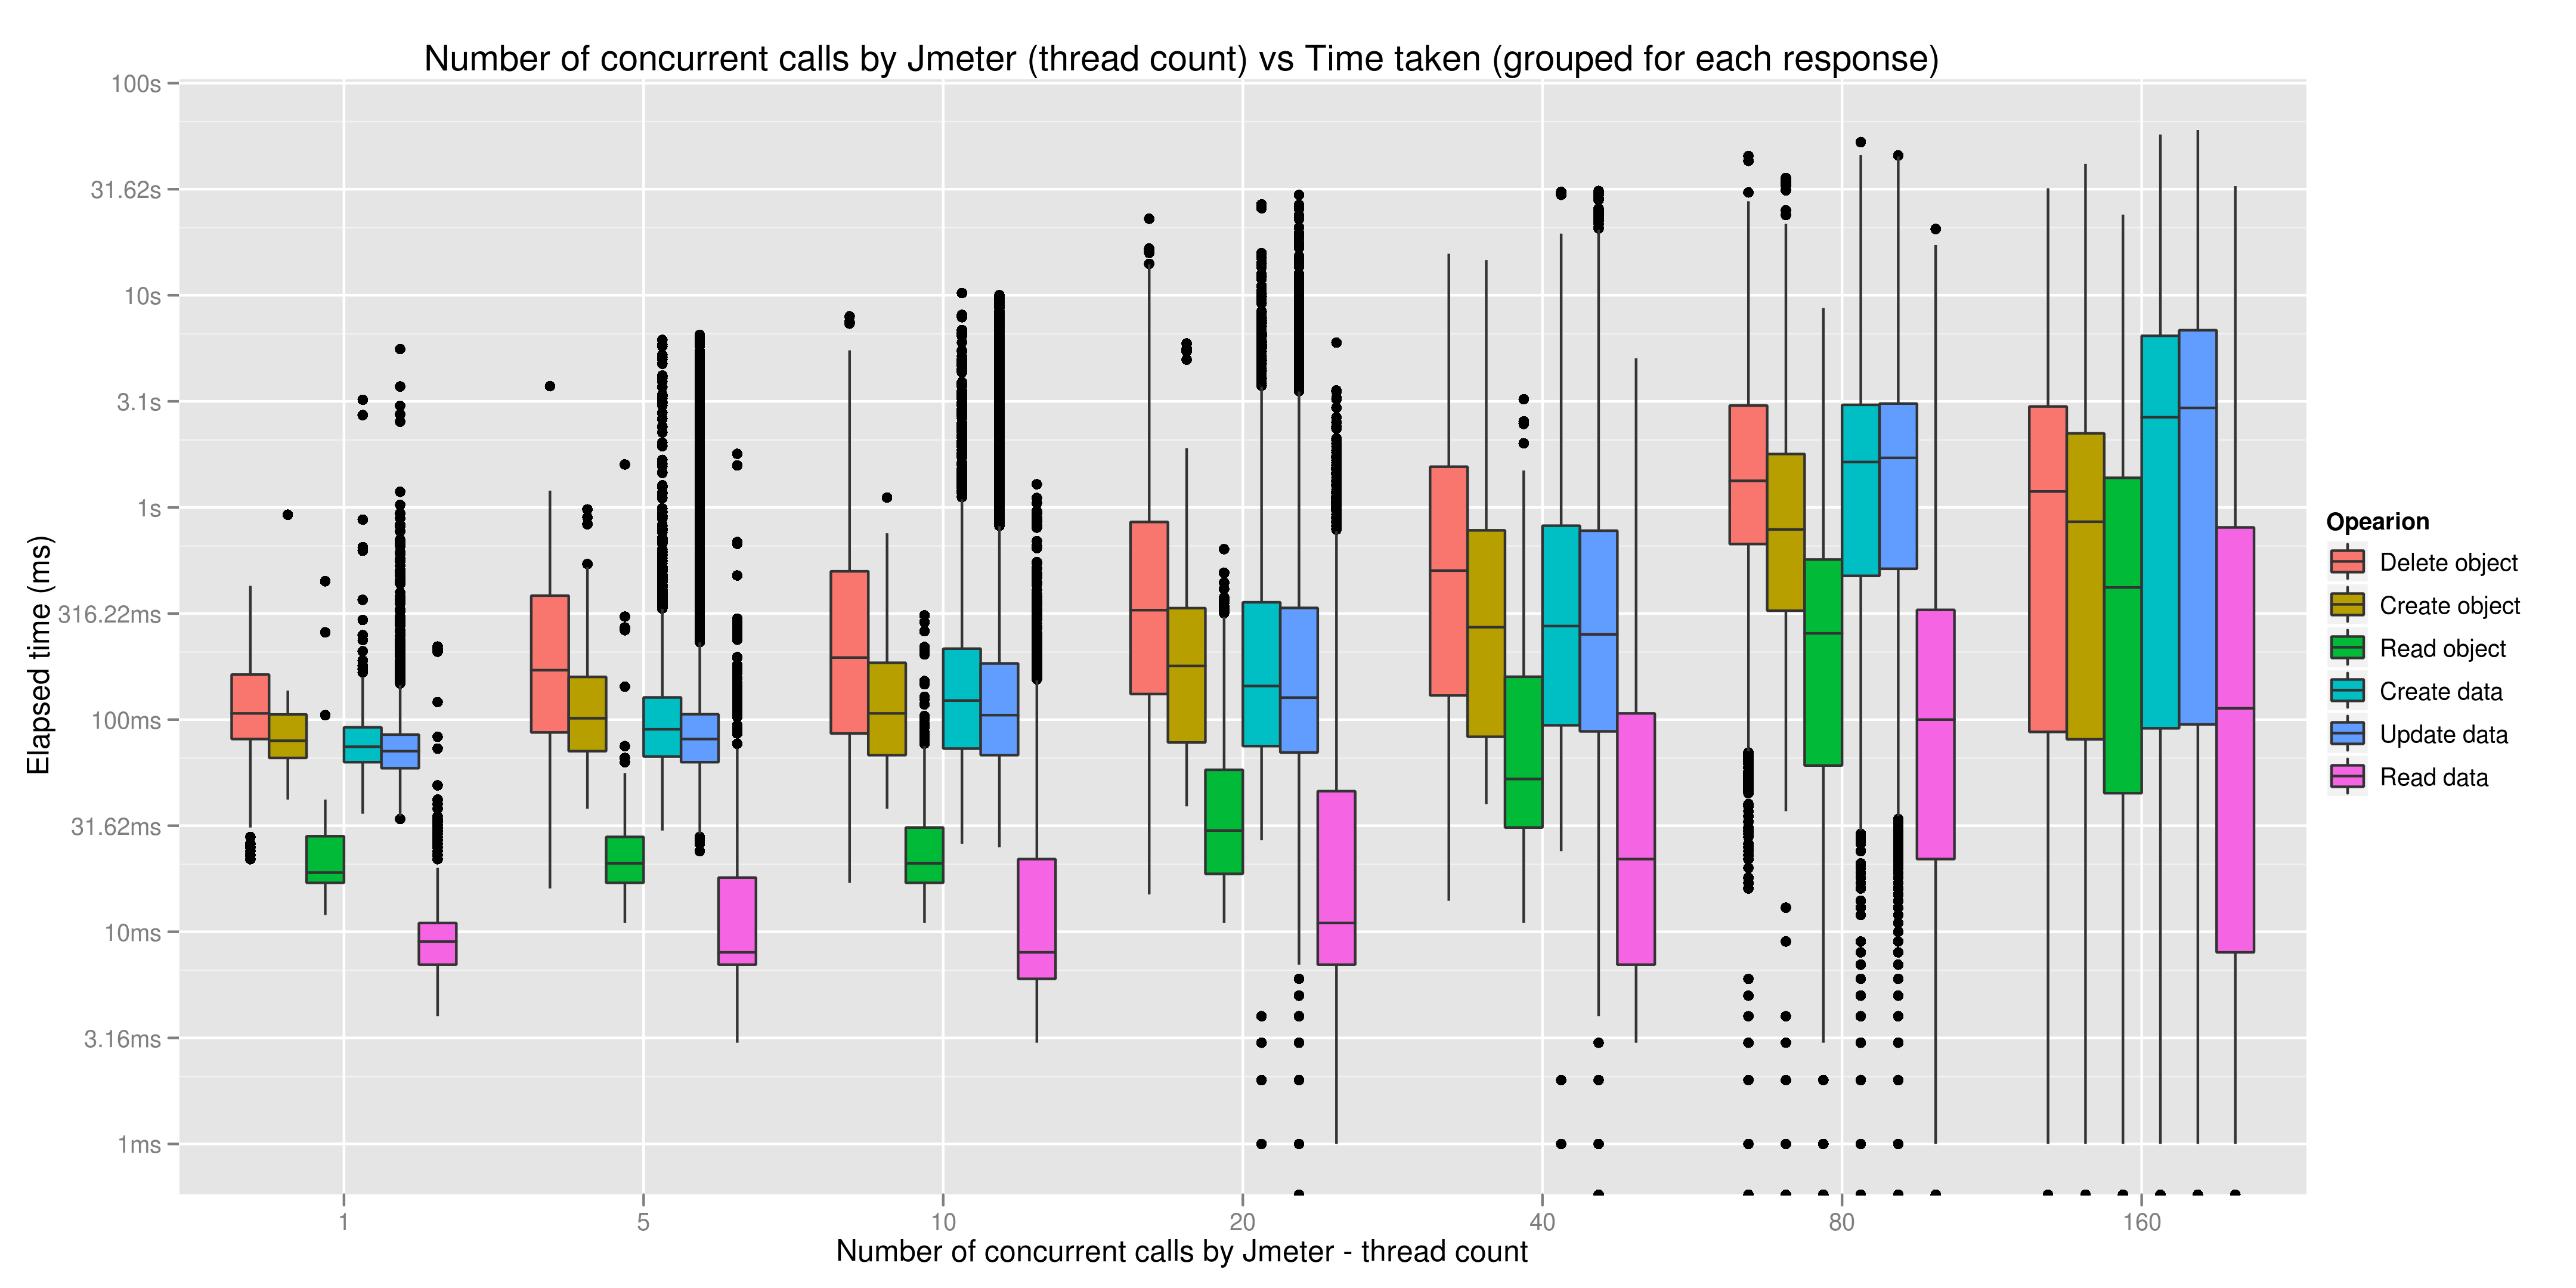
A box plot of Thread count vs Time taken to complete a response, for each of the operations
Analysing the test results
The stats visualizations were done using R (http://www.r-project.org/).
The code used to produce the graphs is in fedora-jmx.r.
- To execute the code
$ R
> source('/path/to/the/file/fedora-jmx.r') - The program will ask you to choose the directory which contains the test results (csv format)
- It will run through all the files, gather the data and produce 3 graphs and a summary of the data. These will be saved in your current working directory.
...