What are we testing?
The performance of Fedora when performing create, read and delete operations of Fedora objects and datastreams using Fedora's REST API.
See FF+Candidate+Test+Harness for information regarding the test harness, an explanation of the test results and analysing the test results
Test System
Fedora version: 3.6.2 installed on futures6 (see Test Platform for details)
System information: The systemInfo.txt has information about the system on which the tests were done is placed at systemInfo.txtperformed
- This was gathered using the script gatherSystemInfo.sh
Test Harness
The test was done using Apache JMeter
The Jmeter script used for the test is Fedora.jmx published in the github repo ff-jmeter-madness
This was run from Futures1
The test script fedoraTest.sh was used to execute the test code with the different test parameters - file size and thread count
The test scripts, results and the graphs generated are available on github at https://github.com/futures/Github is also used to publicize and keep track of the outcome of the test results at ff-jmeter-testResults - /tree/master/2013-02-0110-FedoraTests
Test Parameters
Number of Threads: The number of threads concurrent requests Jmeter will use to execute the testgenerate, when executing the tests
Number of Loops: Configures the number of datastreams in the fedora object
File size - A set of files are generated on the fly. The file size is based on the mean and standard deviation
...
mean and standard deviation - Used to produce random binary data, from the stable set of file sizes
| Parameter | Values | |||||||||||
|---|---|---|---|---|---|---|---|---|---|---|---|---|
| Number of threads | 1 | 5 | 10 | 20 | 40 | 80 | 160 | |||||
| Number of loops | 10 | |||||||||||
| File size - Mean (bytes) | 1 | 1024 (1k) | 8192 (8k) | 104858 (100k) | 1048576 (1M) | 8388608 | 107374182 | |||||
File size - Standard deviation (bytes) | 0.1 | 102 | 819 | 10486 | 104858 | 838861 | 10737418||||||
The binary data created during the test run, is used as the data for datastreams, in the creation and modification of the datastreams within an object. The size of the binary data is based on the test parameters of mean and standard deviation.
Test Results
- The test was run a total of 14 35 times (7 values of file sizes thread count and two 5 values of thread countfile size)
- The results are logged to csv files and have been placed in the log directory
- Graphs were generated using R for statistical computing and graphics
Analyzing the test results
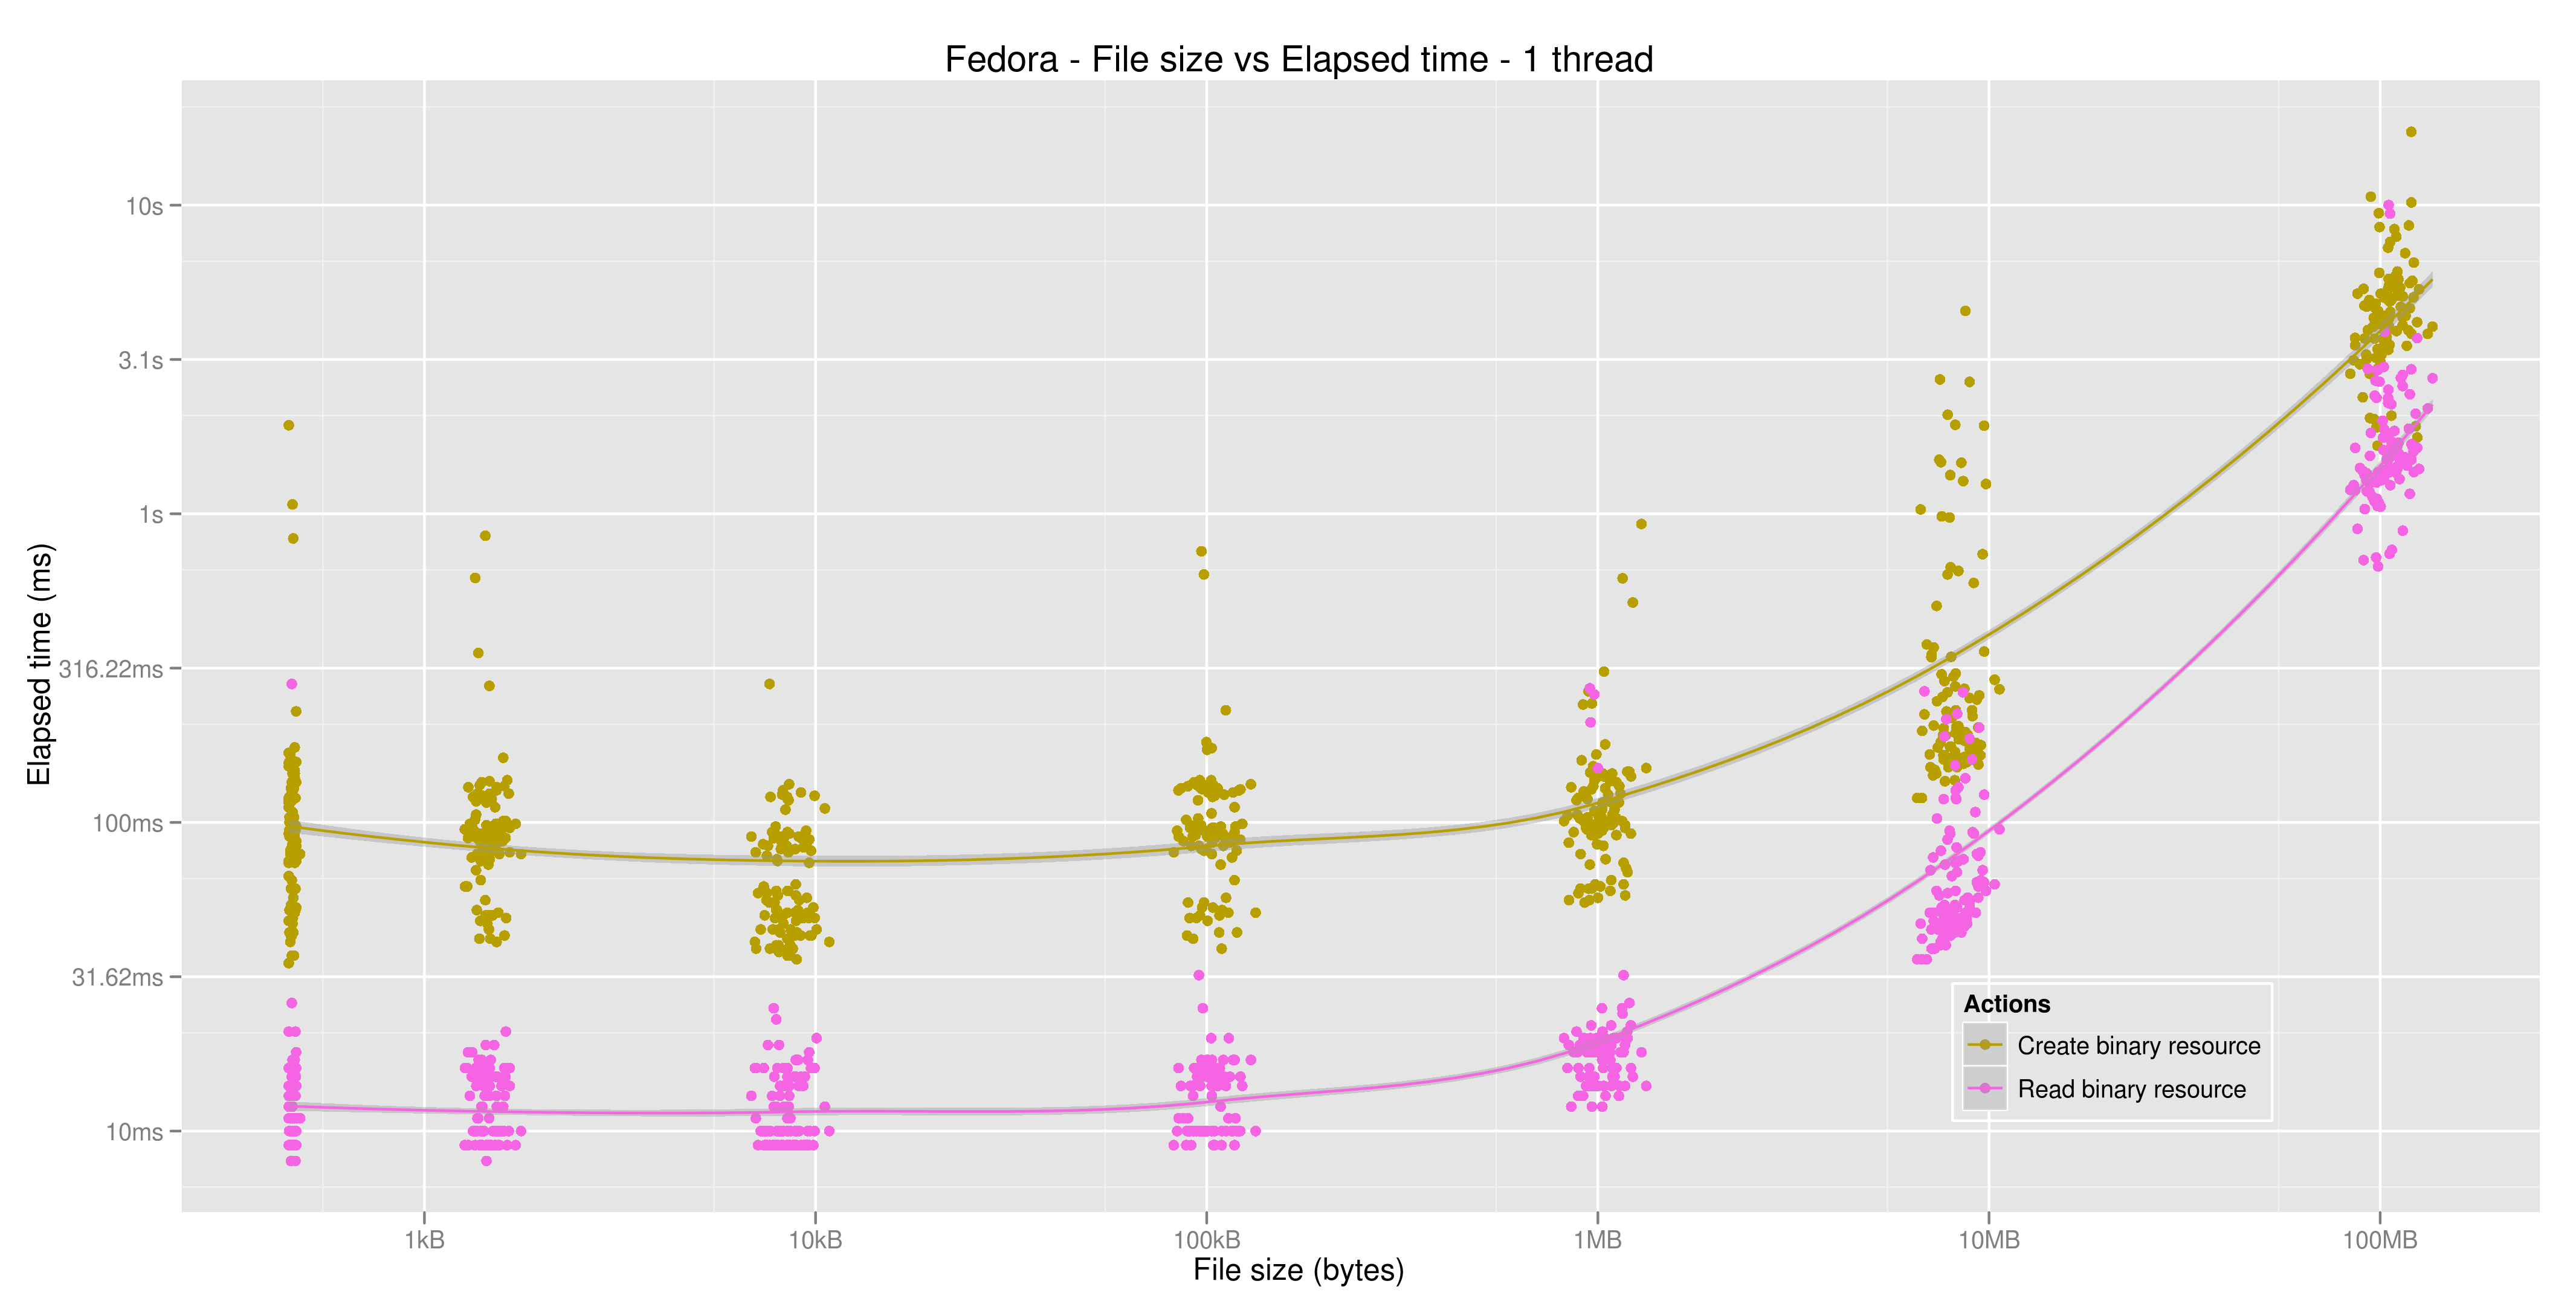
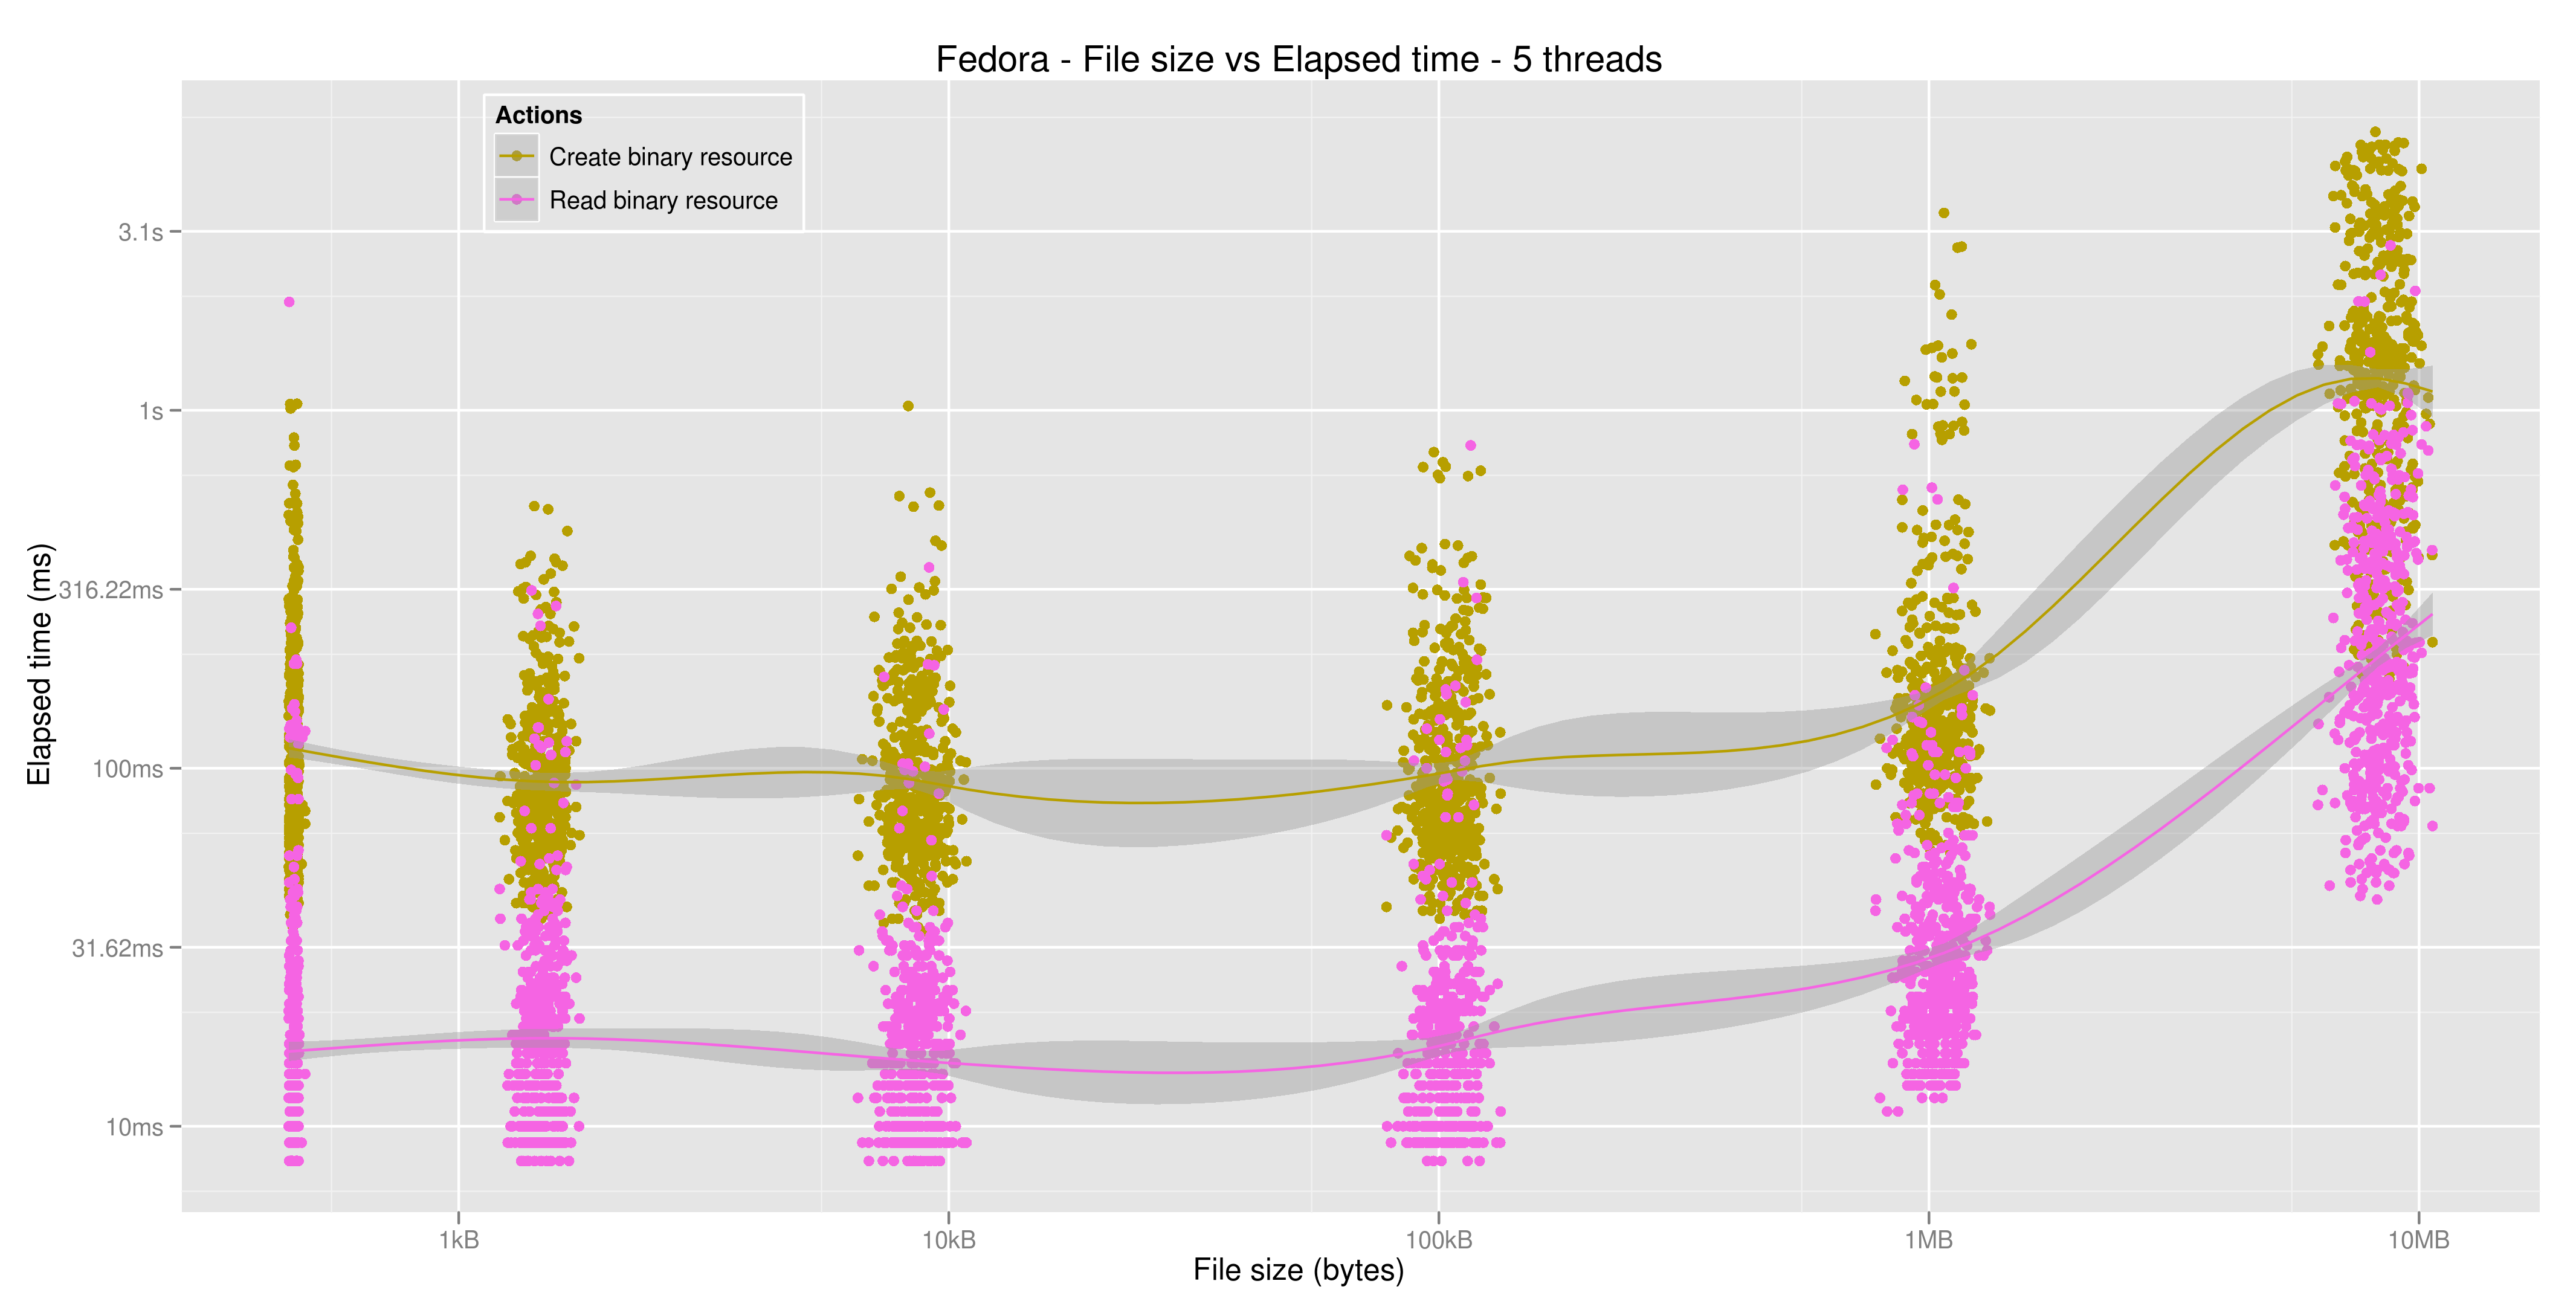
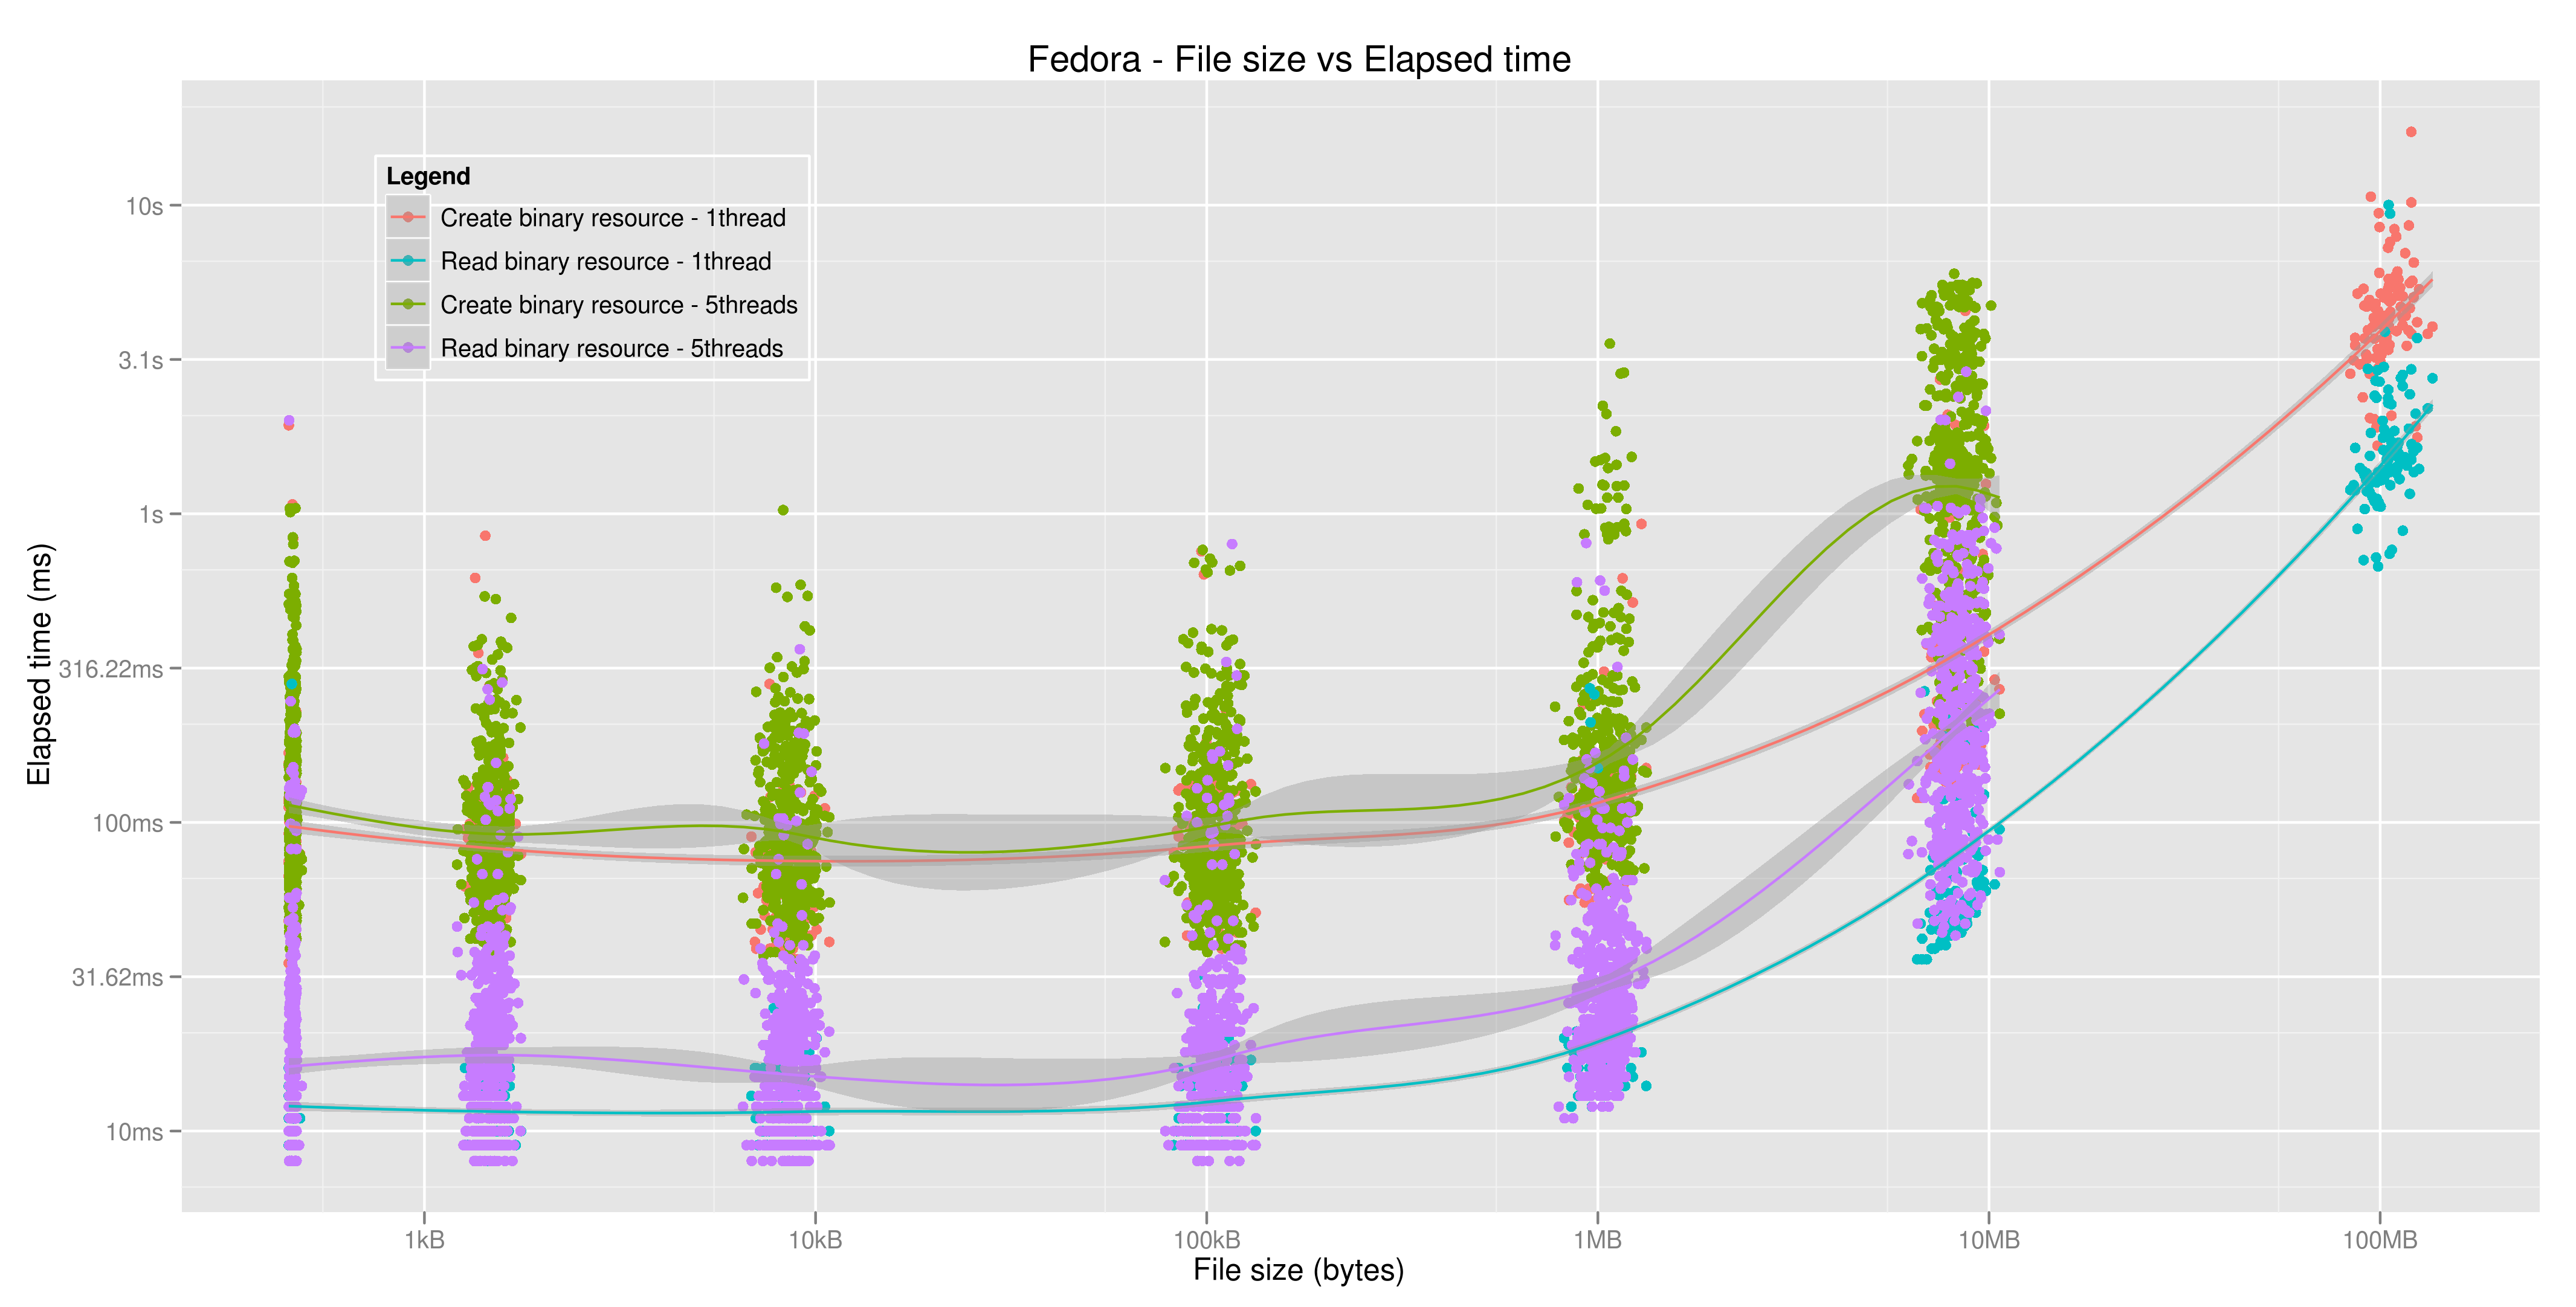
A plot of file size v/s elapsed time - testing the time taken to create a datastream (of differing file sizes) for 1 and 5 threads plotted individually and a combined plot
A plot of file size v/s time taken to transfer each byte - (shows the system latency, especially seen with files of size < 1 MB) for 1 and 5 threads plotted individually and a combined plot
A plot of file size v/s number of bytes transferred in 1 ms - (inverse of the above plots) for 1 and 5 threads plotted individually and a combined plot
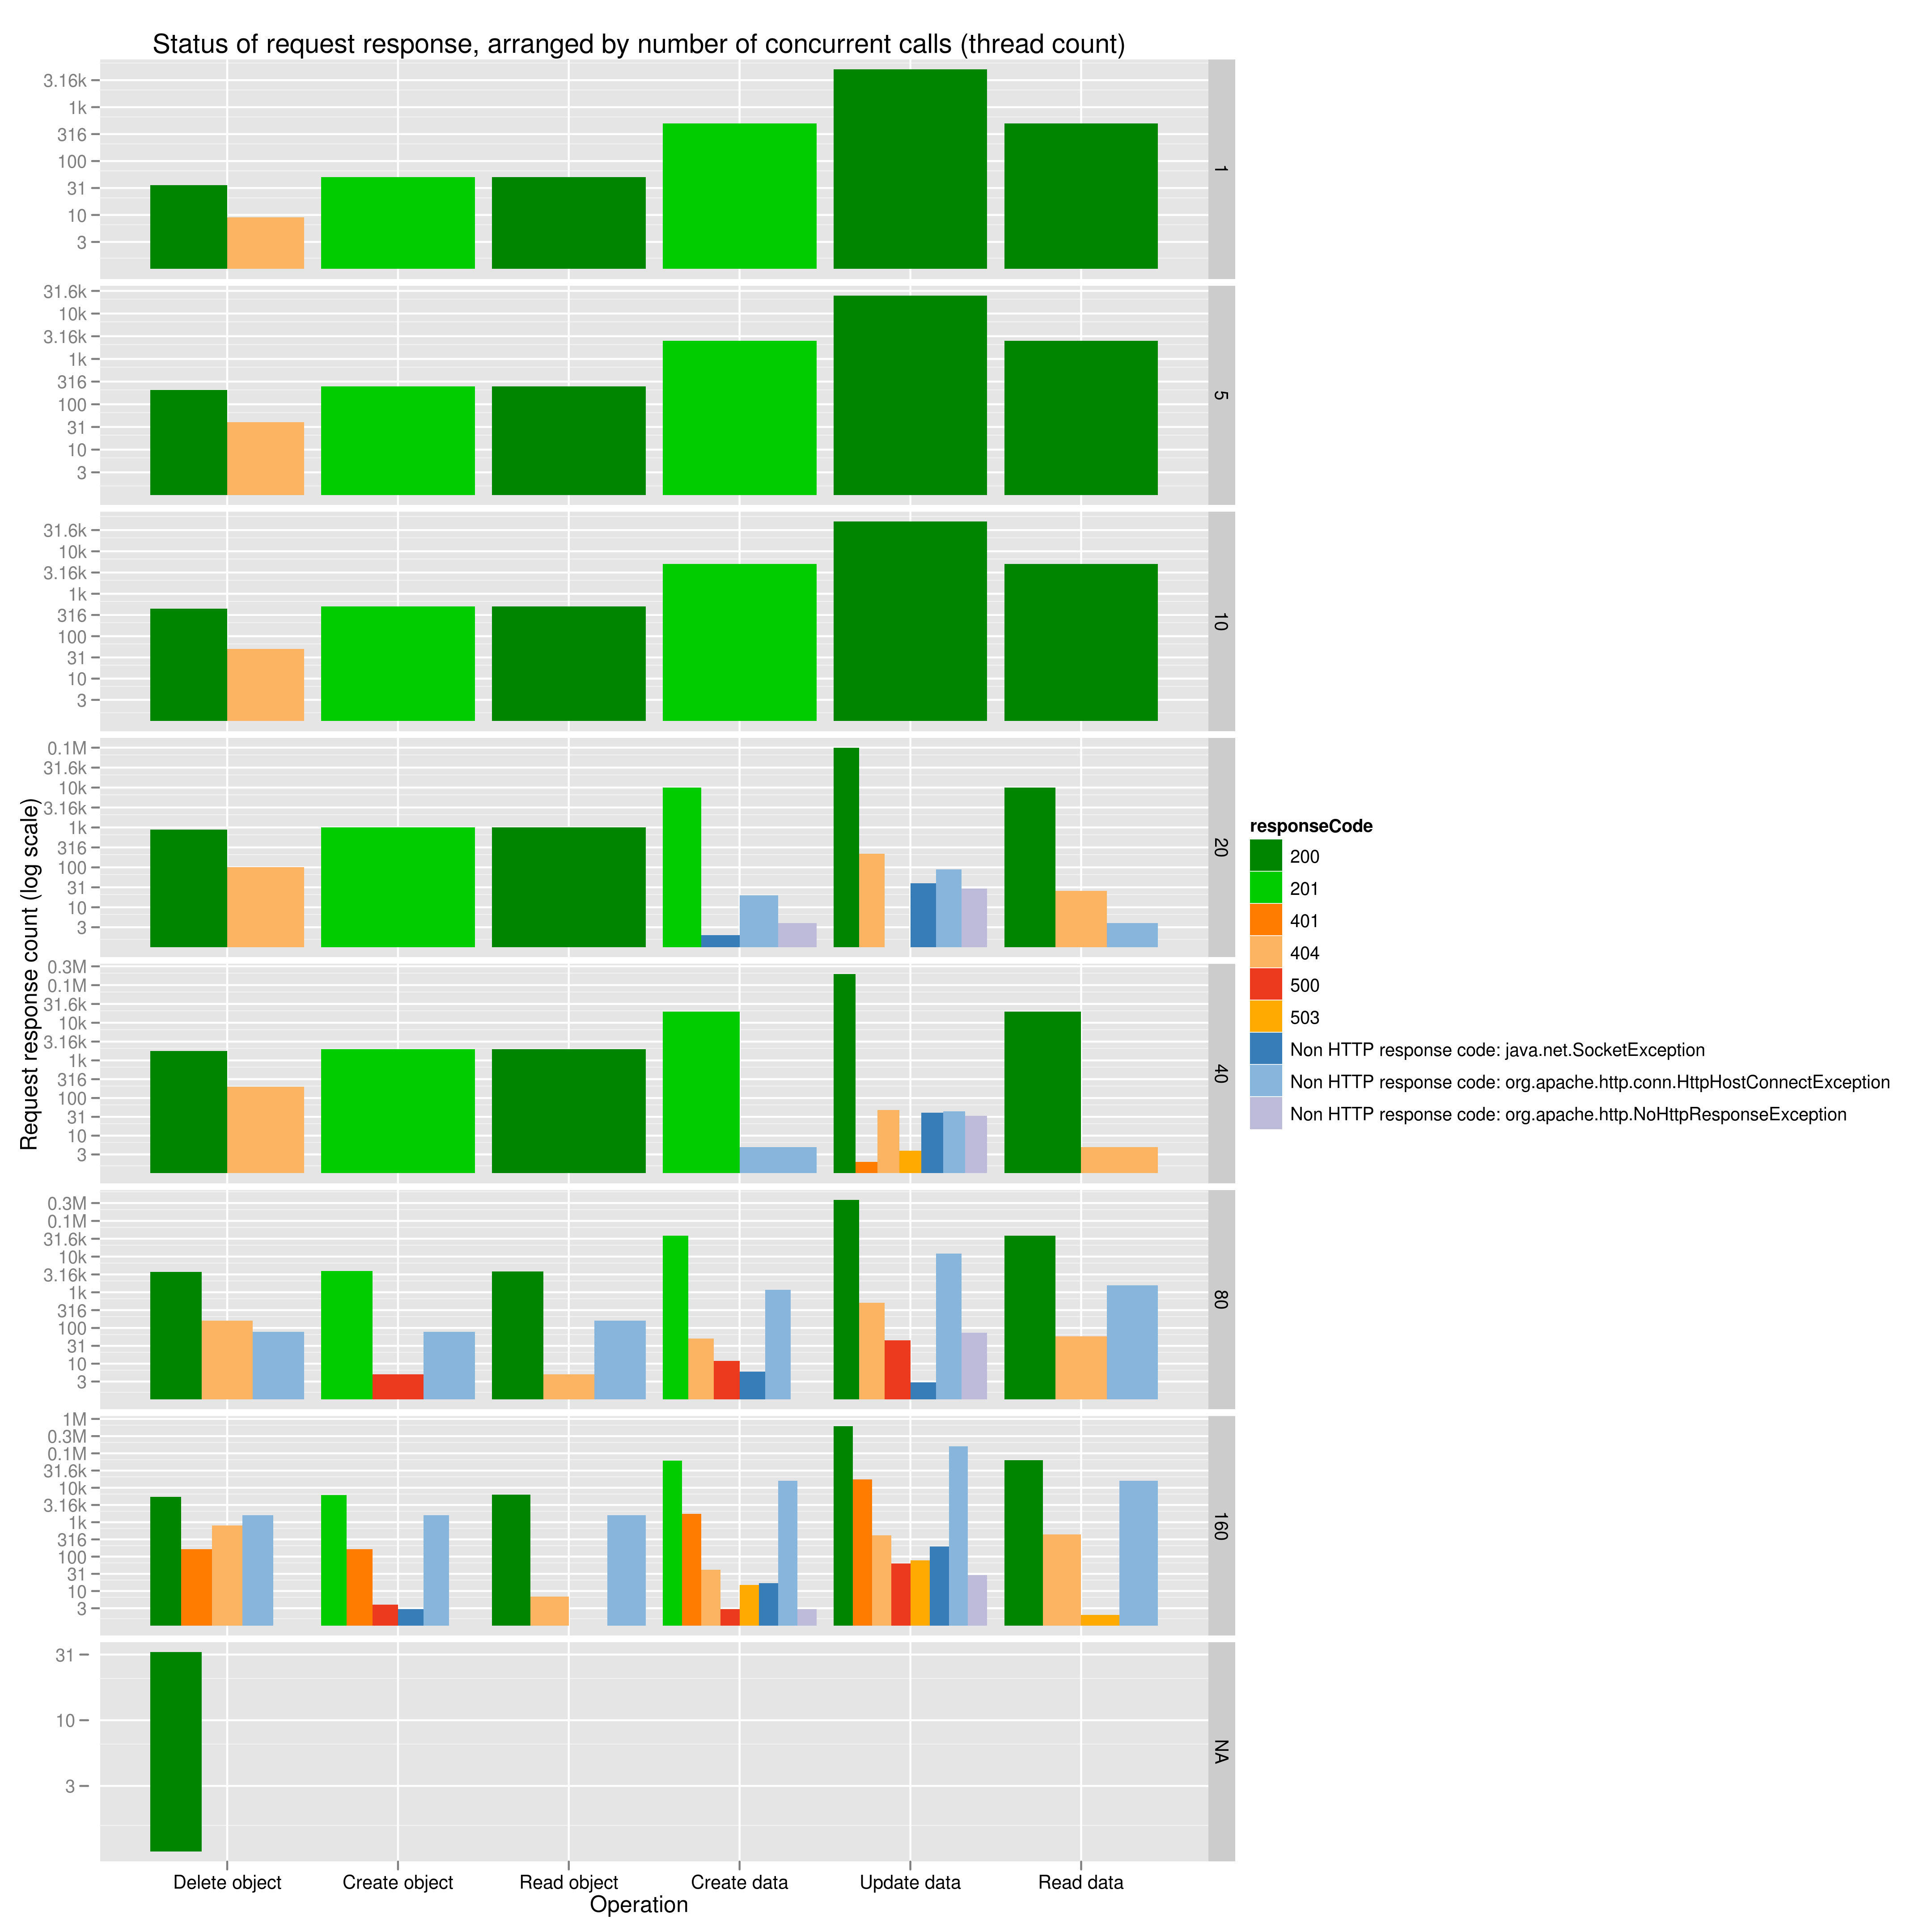
A stacked bar chart of the different response codes received, grouped by thread count
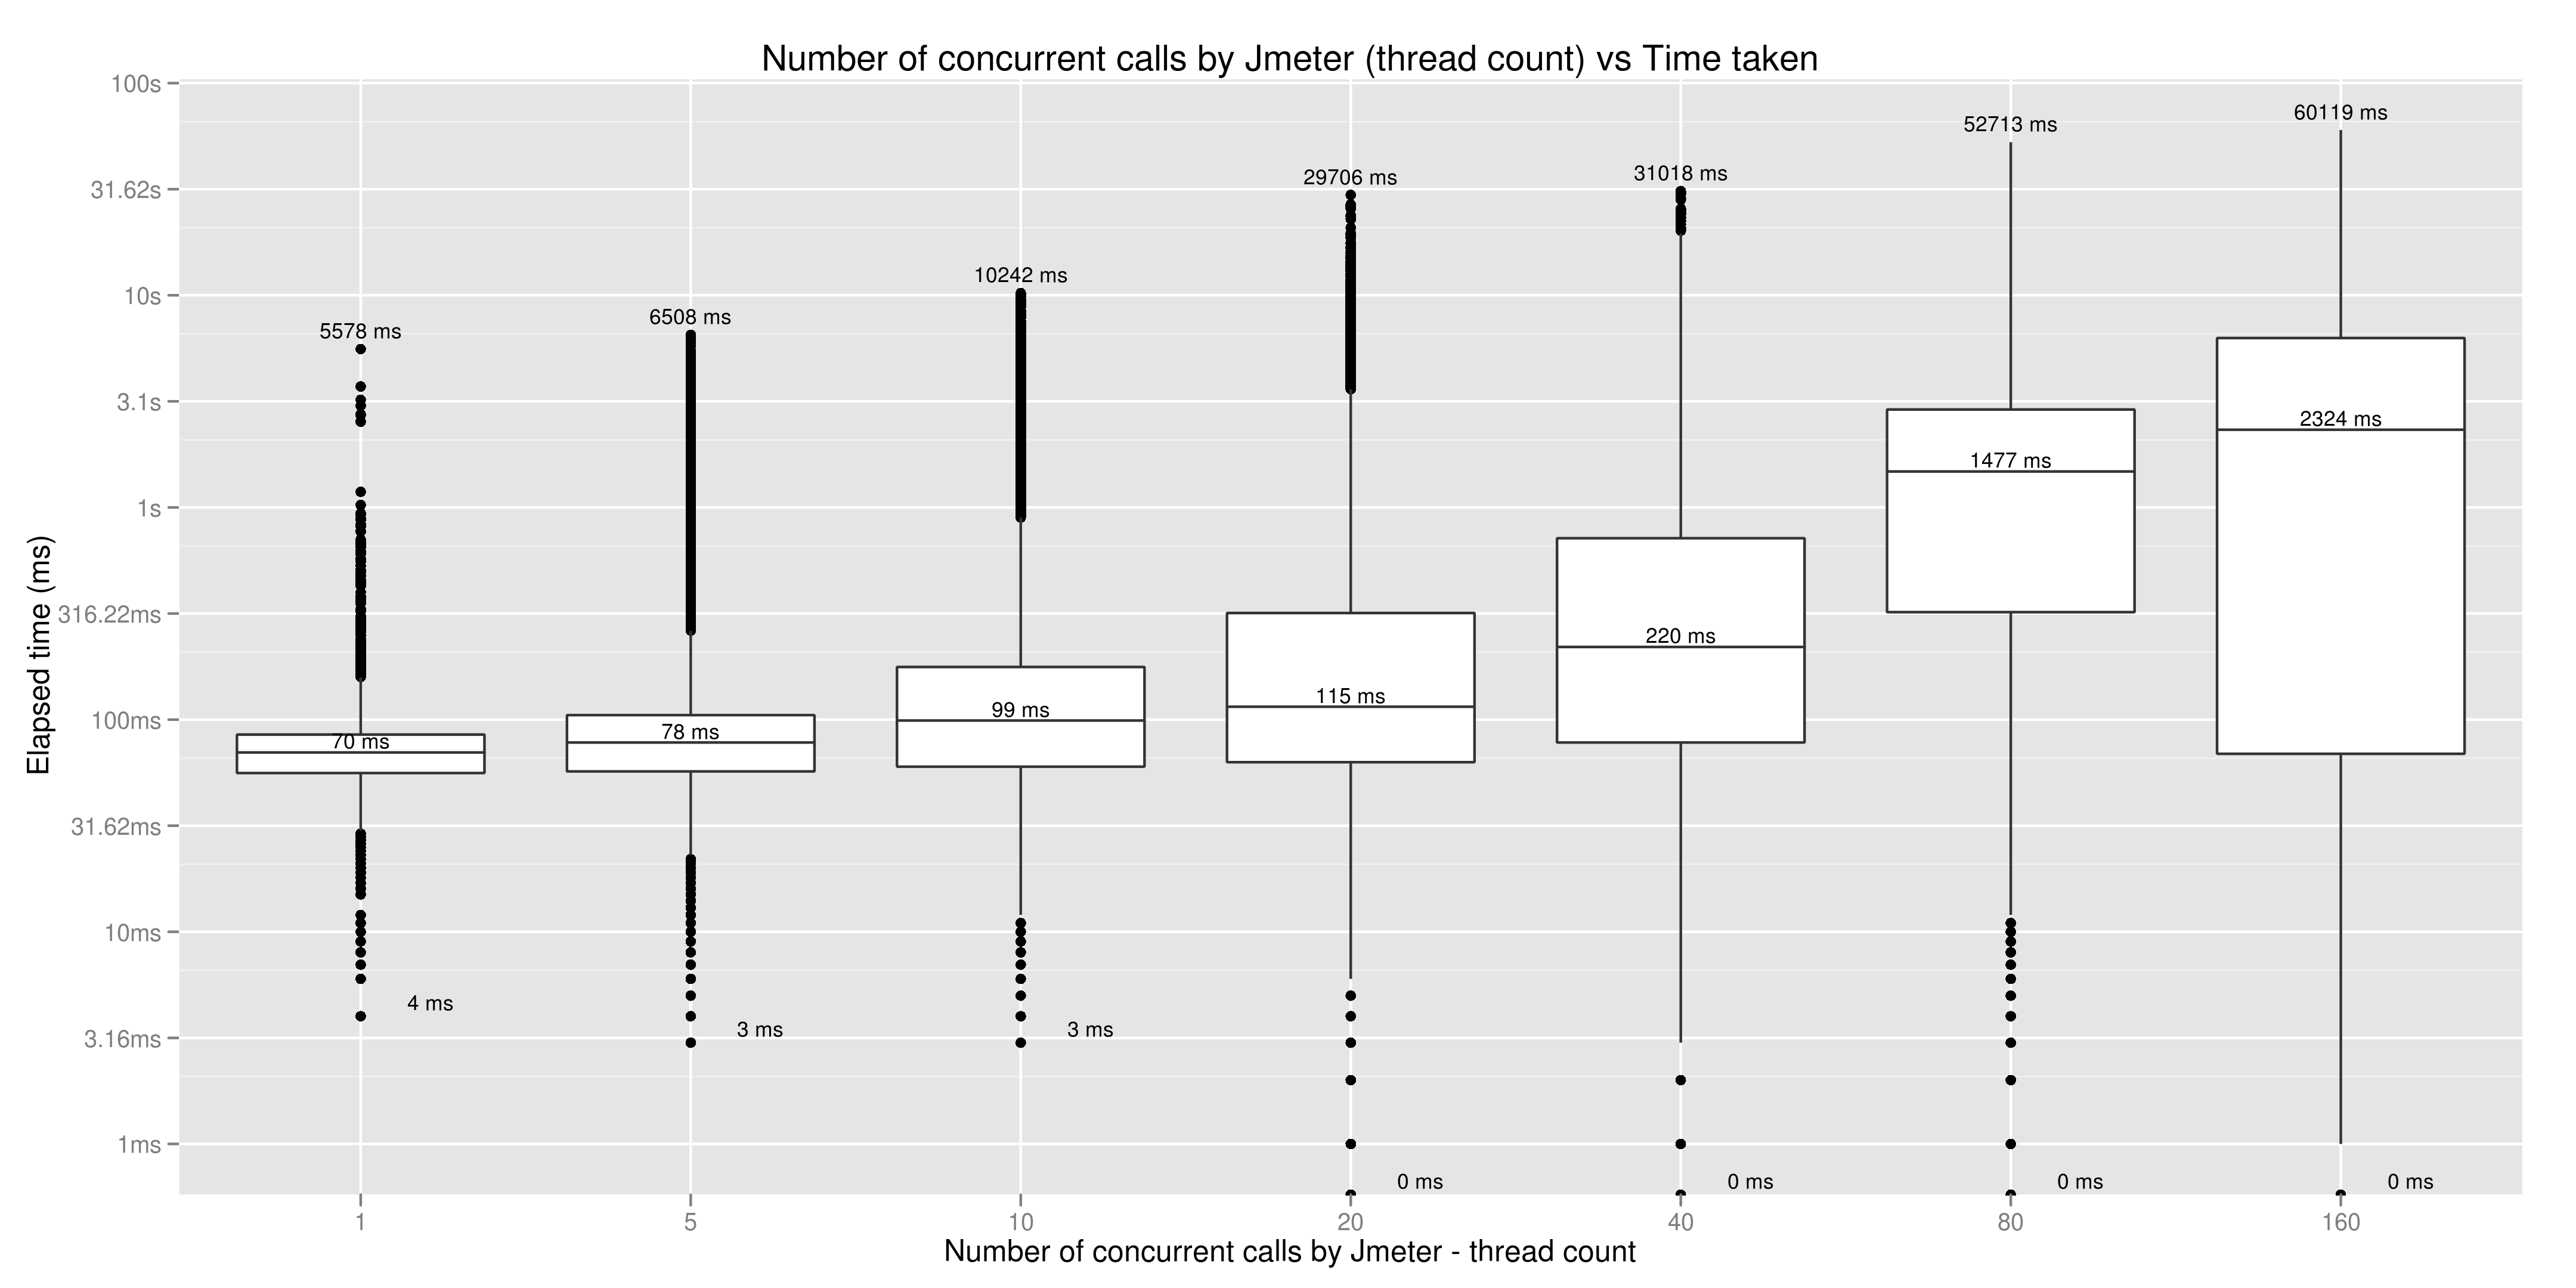
A box plot of Thread count vs Time taken to complete a response
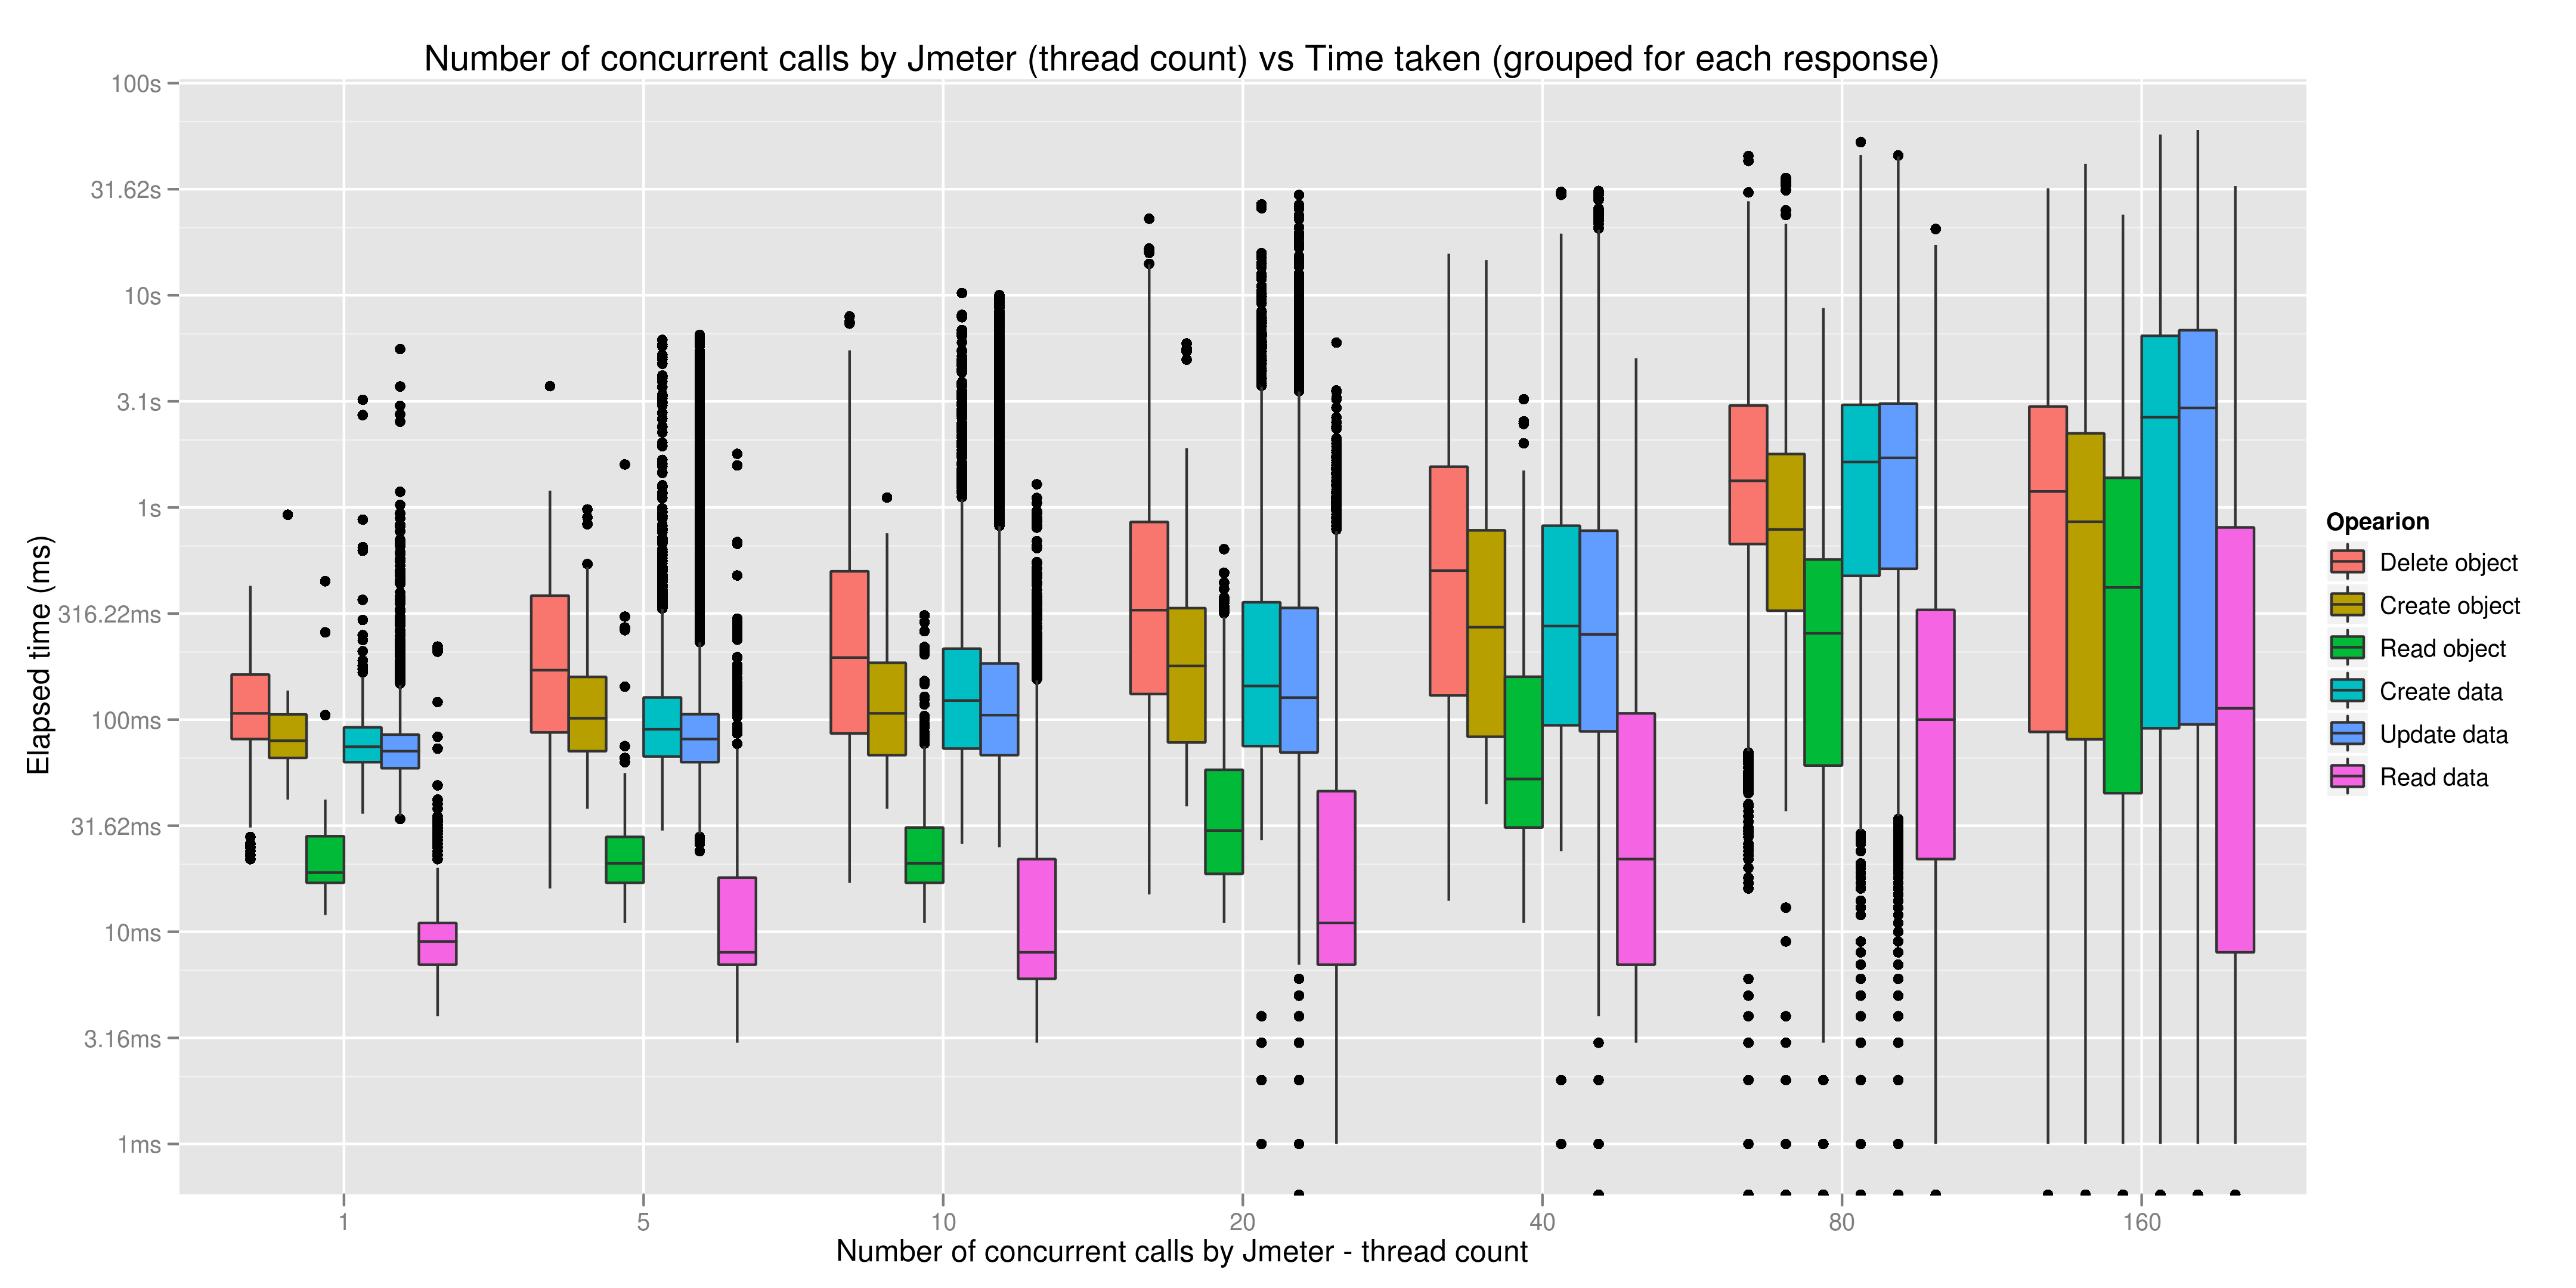
A box plot of Thread count vs Time taken to complete a response, for each of the operations
Analysing the test results
The stats visualizations were done using R (http://www.r-project.org/).
The code used to produce the graphs is in fedora-jmx.r.
- To execute the code
$ R
> source('/path/to/the/file/fedora-jmx.r') - The program will ask you to choose the directory which contains the test results (csv format)
- It will run through all the files, gather the data and produce 3 graphs and a summary of the data. These will be saved in your current working directory.
...