...
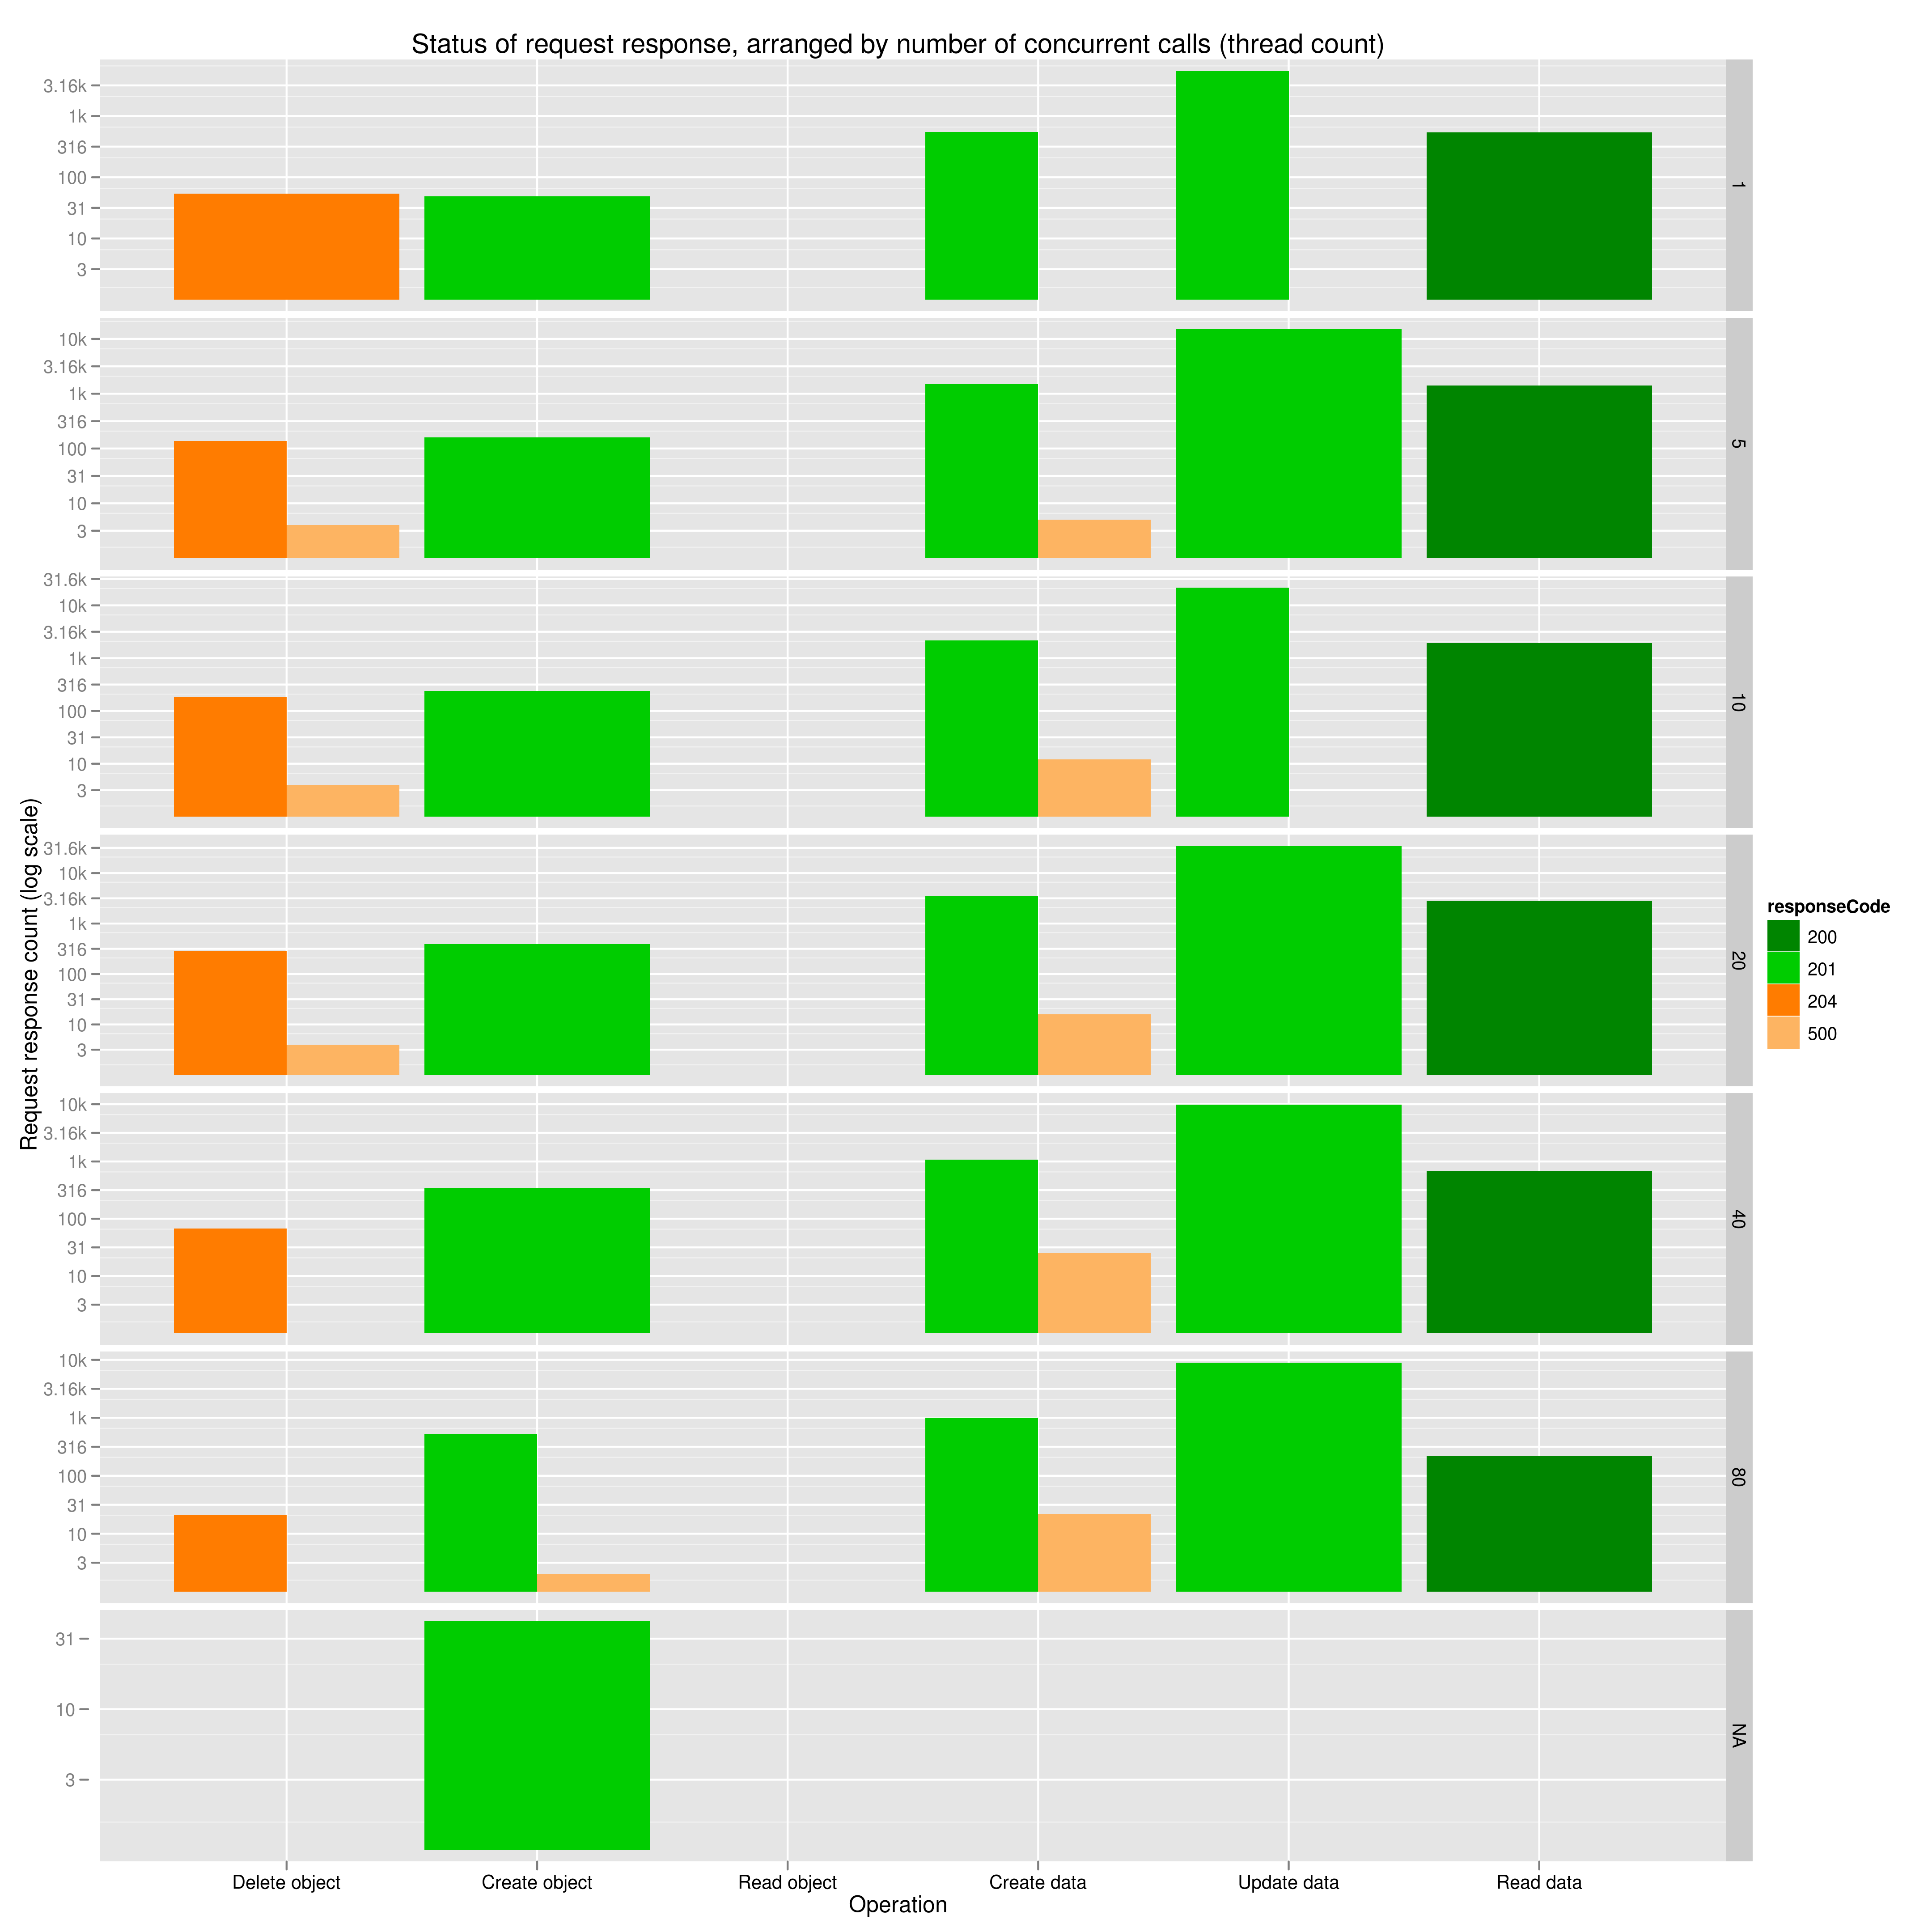
A stacked bar chart of the different response codes received, grouped by thread count

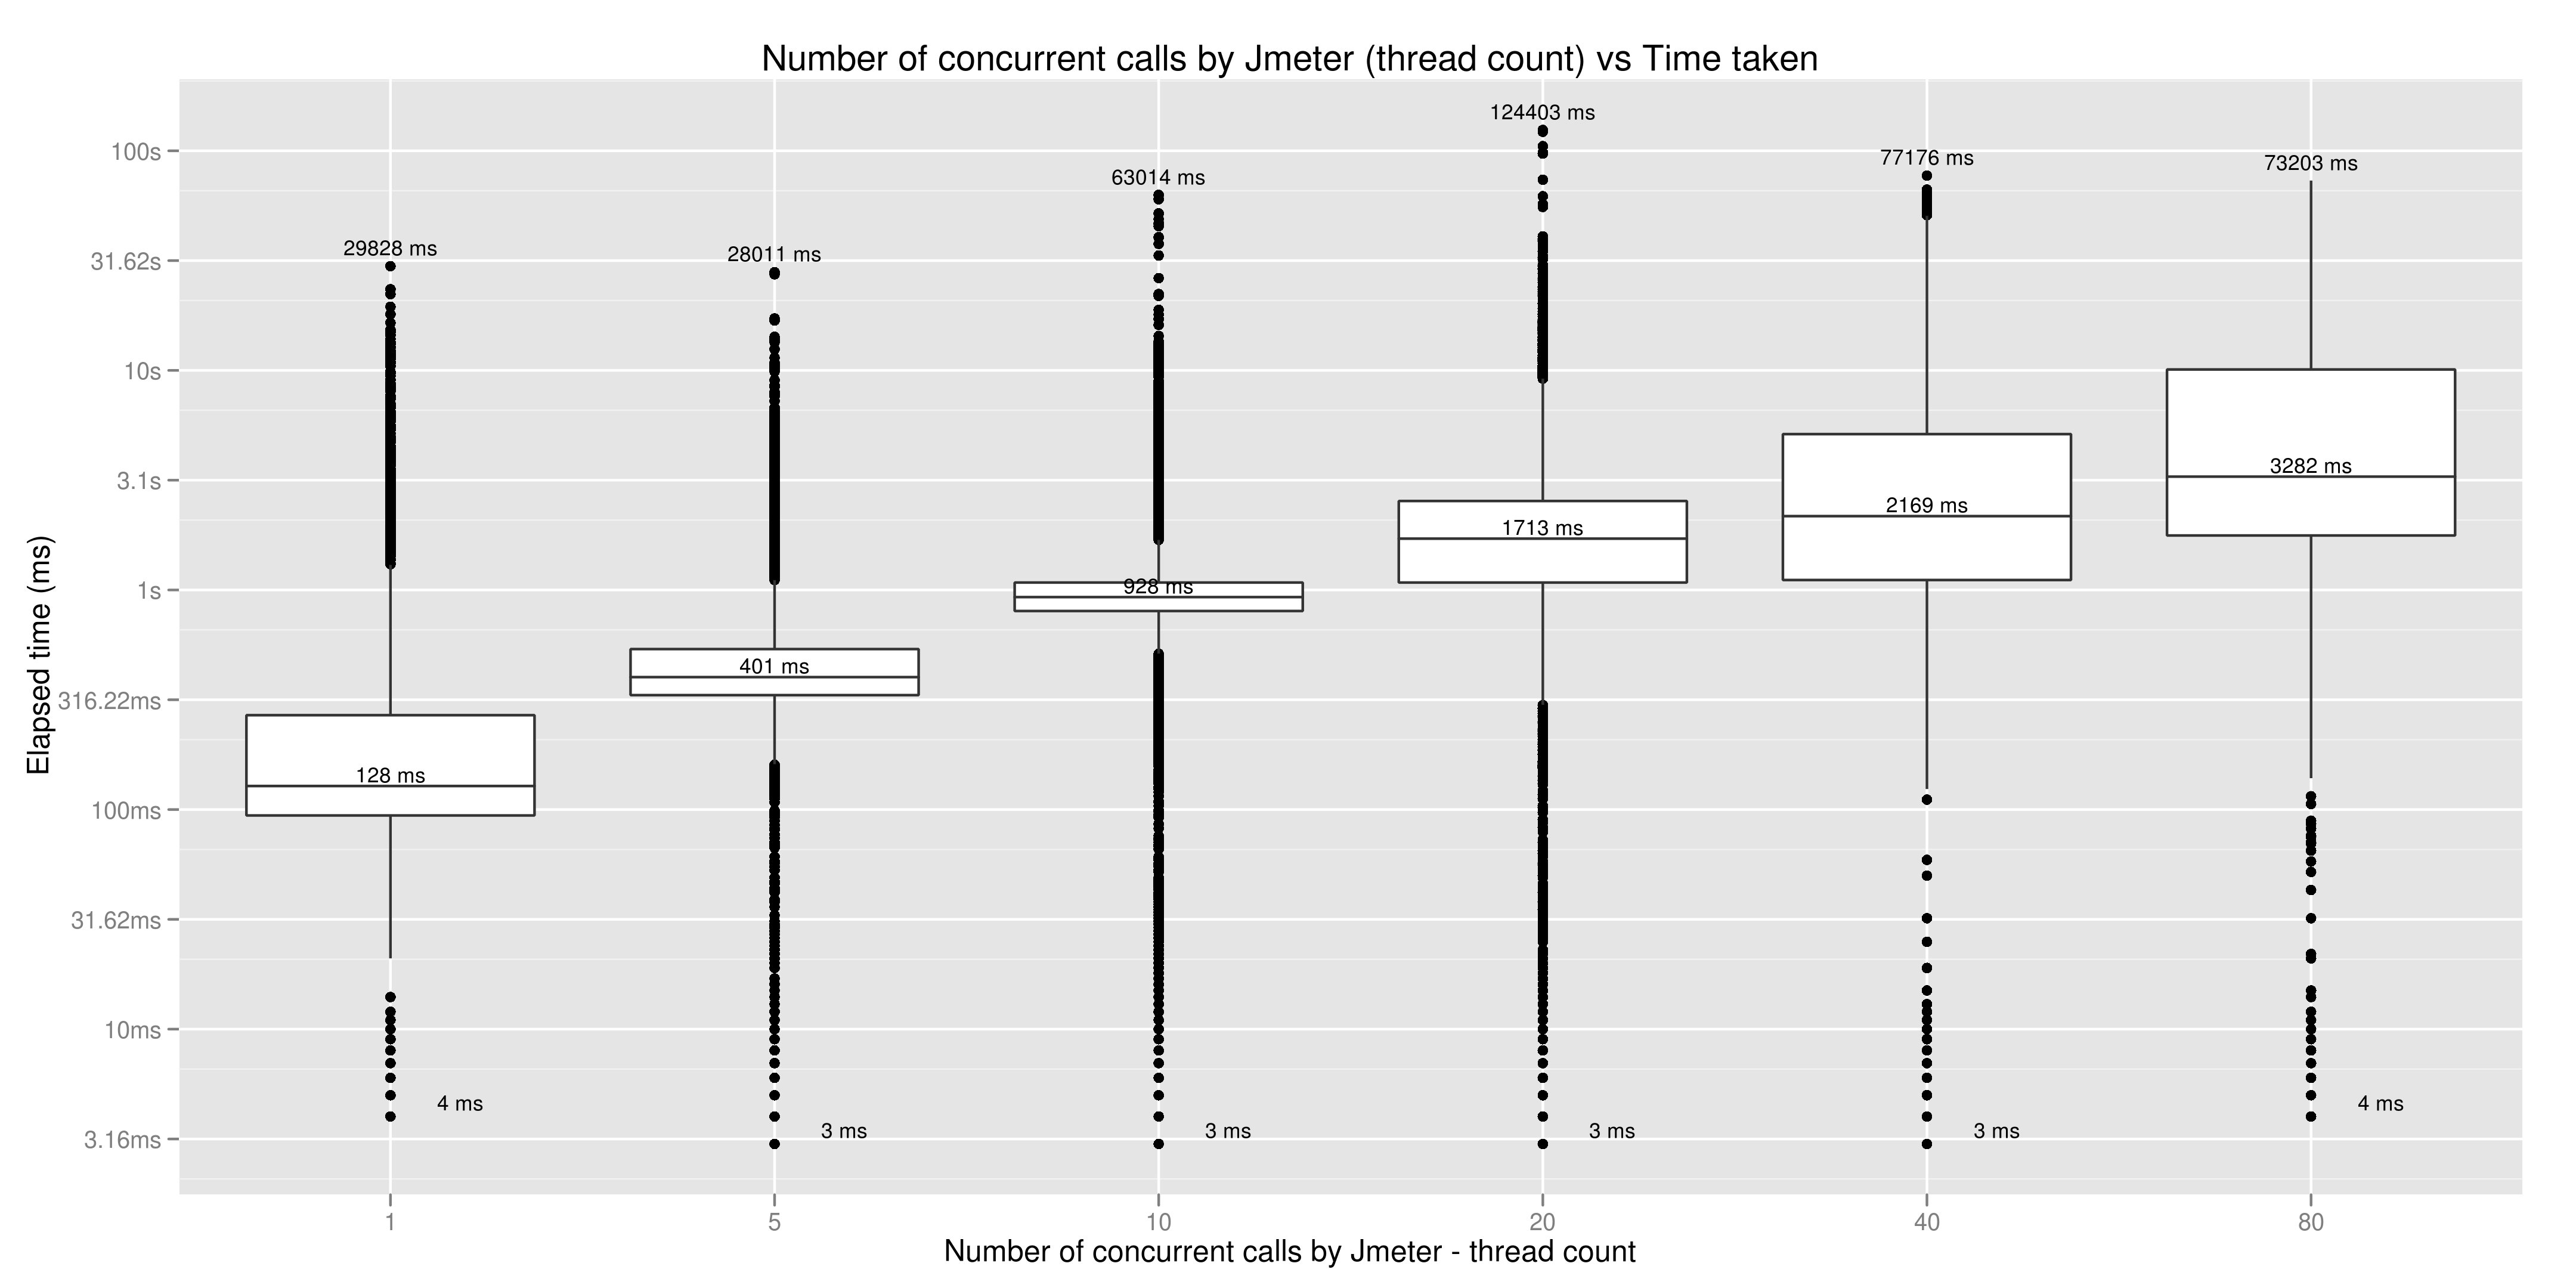
A box plot of Thread count vs Time taken to complete a response

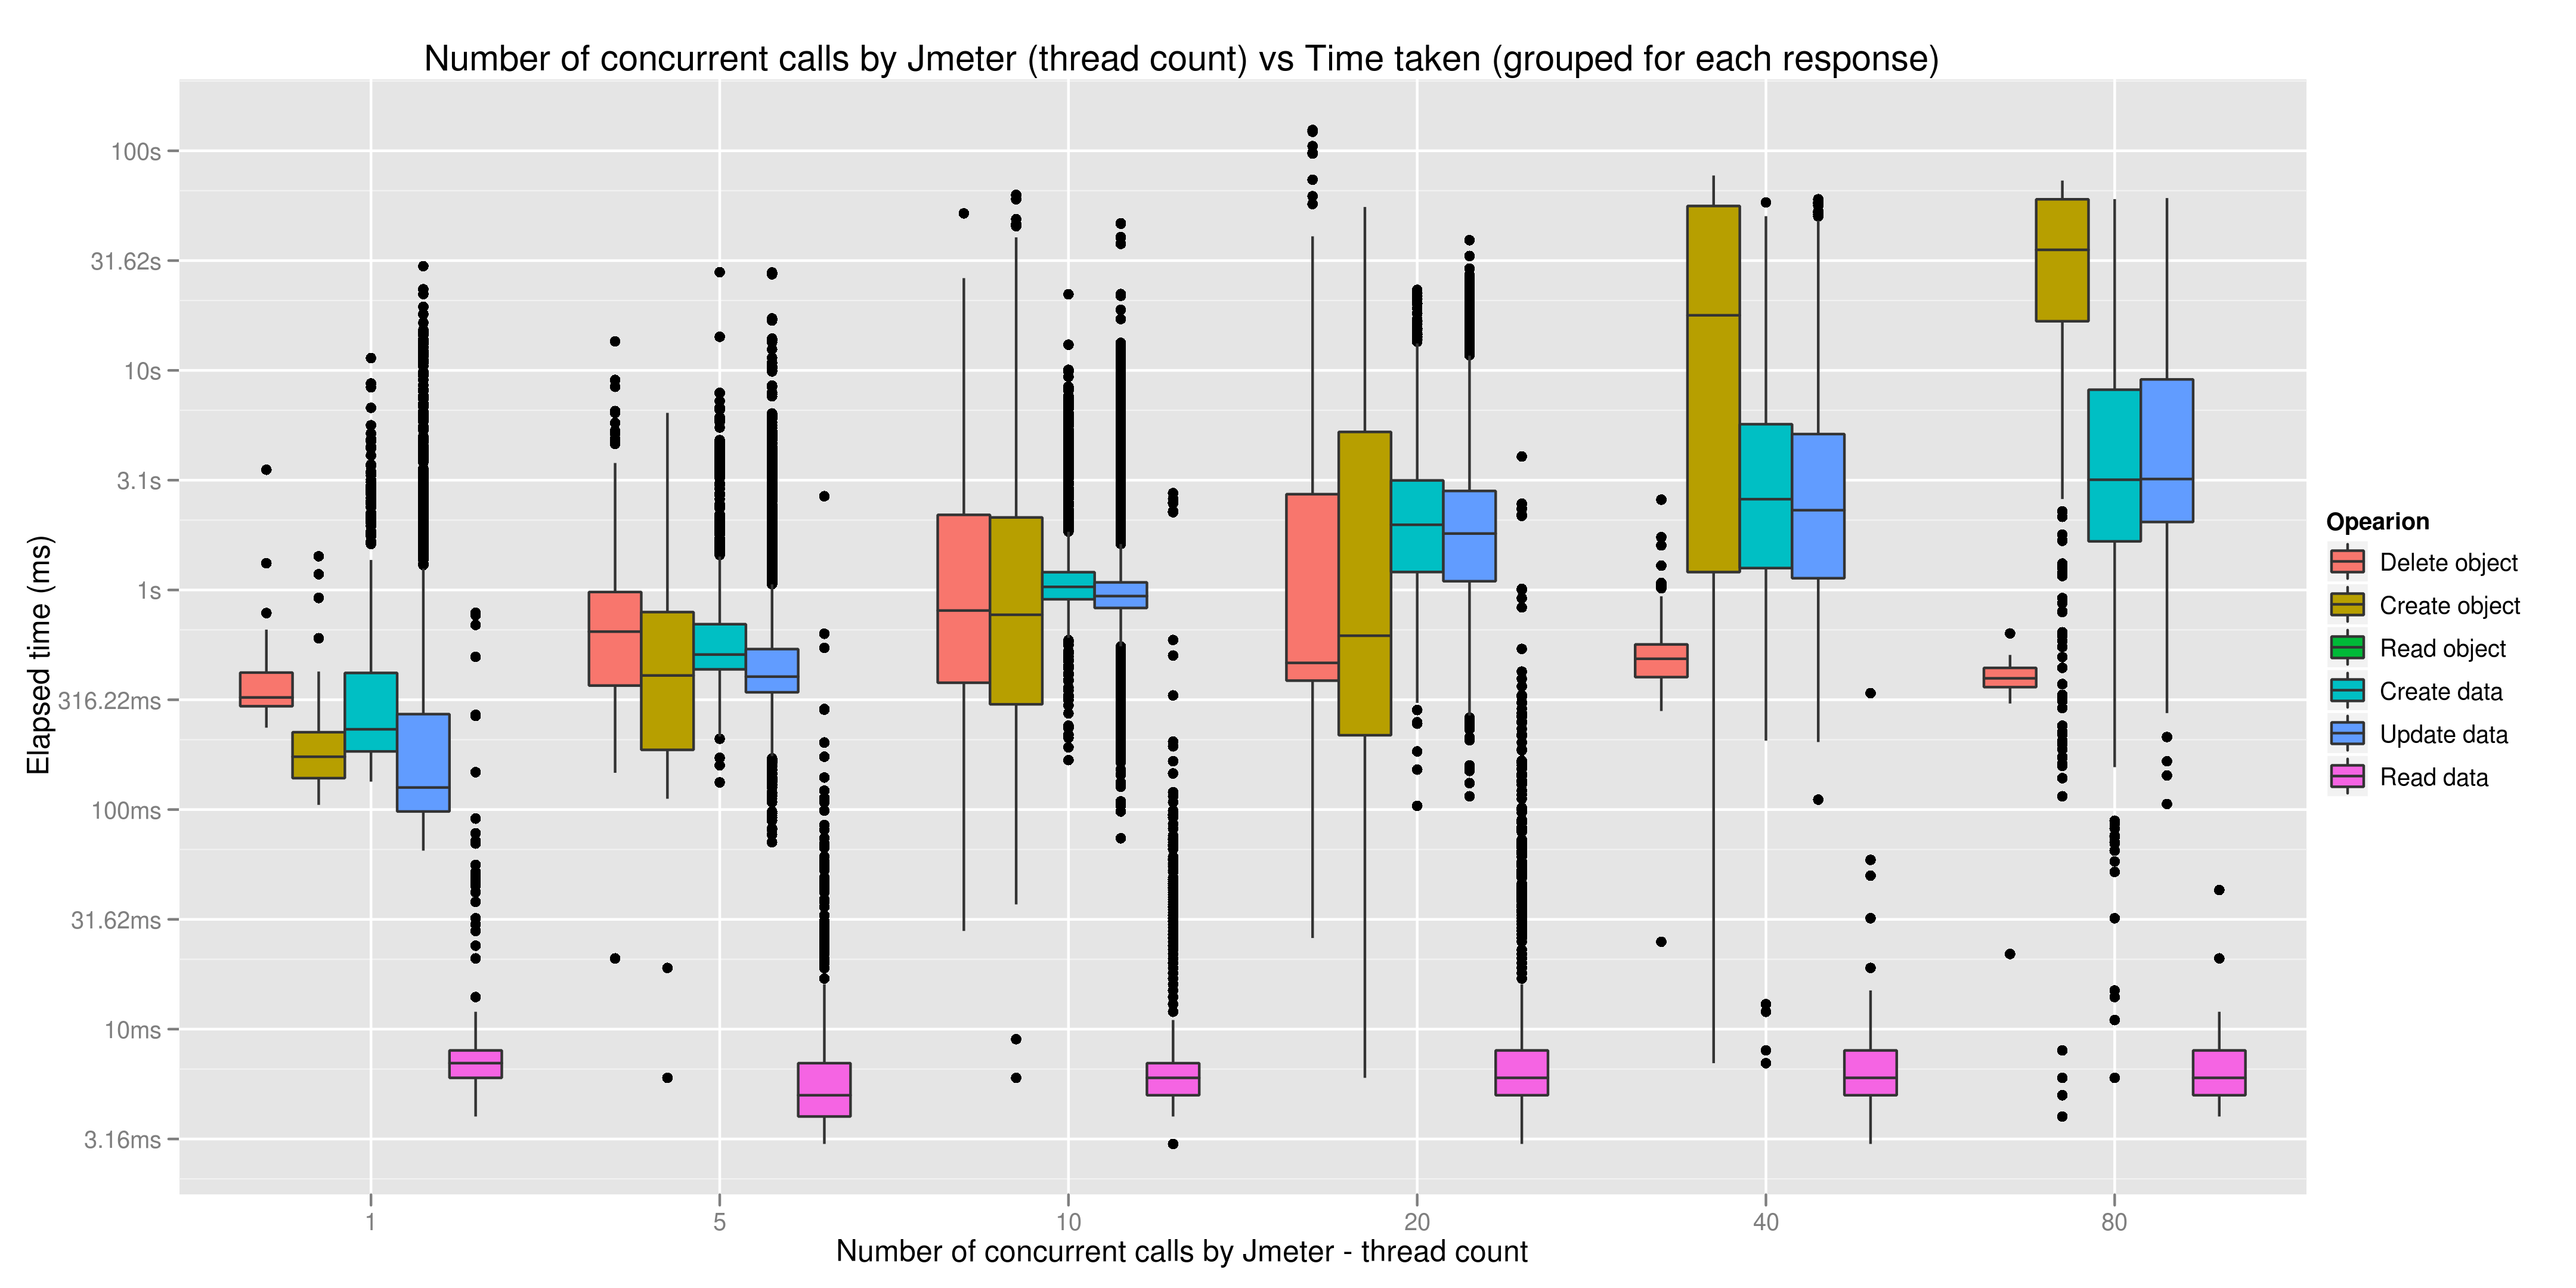
A box plot of Thread count vs Time taken to complete a response, for each of the operations
 Image Added
{"serverDuration": 92, "requestCorrelationId": "d88d0ff434366510"}