...
The performance of Fedora 4 when performing create, read and delete operations of Fedora objects and datastreams using Fedora 4's REST API.
Test System
Fedora version 4 installed on futures6 test servers (see Test Platform for details)
System information: 'systemInfo.txt' has information about the system on which the tests were performed
...
, gathered using the script 'gatherSystemInfo.sh'
- Tests as of 2013-06-03
- Tests as of 2013-04-25:
Test Harness
See FF + Candidate + Test + Harness for information regarding the test harness, an explanation of the test results and analysing the test results
...
The Jmeter script used for the test is Fedora'plans/fedora.jmx published ' published in the github repo ff-jmeter-madness
- With the Fedora 3 tests disabled - Fedora 3 Describe, Delete Fedora 3 Existing Objects, Fedora 3 thread group (testing Fedora4 only)Version of Fedora.jmx with the Fedora3 tests disabled
This was run from Futures1
The test script 'fedora4Test.sh' was used to execute the test code with the different test parameters - file size and thread count
- Tests as of 2013-06-03
- Tests as of 2013-04-25
The test scripts, results and the graphs generated are available on github at:
- 2013-06-03: https://github.com/futures/ff-jmeter-testResults/tree/master/2013-06-03-Fedora4Tests
- 2013-04-25: https://github.com/futures/ff-jmeter-testResults/tree/master/2013-04-25-Fedora4Tests
Test Parameters
Number of Threads: The number of concurrent requests Jmeter JMeter will generate, when executing the tests
...
- The test was run a total of 42 times (6 values of thread count and 7 values of file size)
- The results are logged to csv files and have been placed in the log directory
- Graphs were generated using R for statistical computing and graphics
A stacked bar chart of the different response codes received, grouped by thread count

A box plot of Thread count vs Time taken to complete a response
...
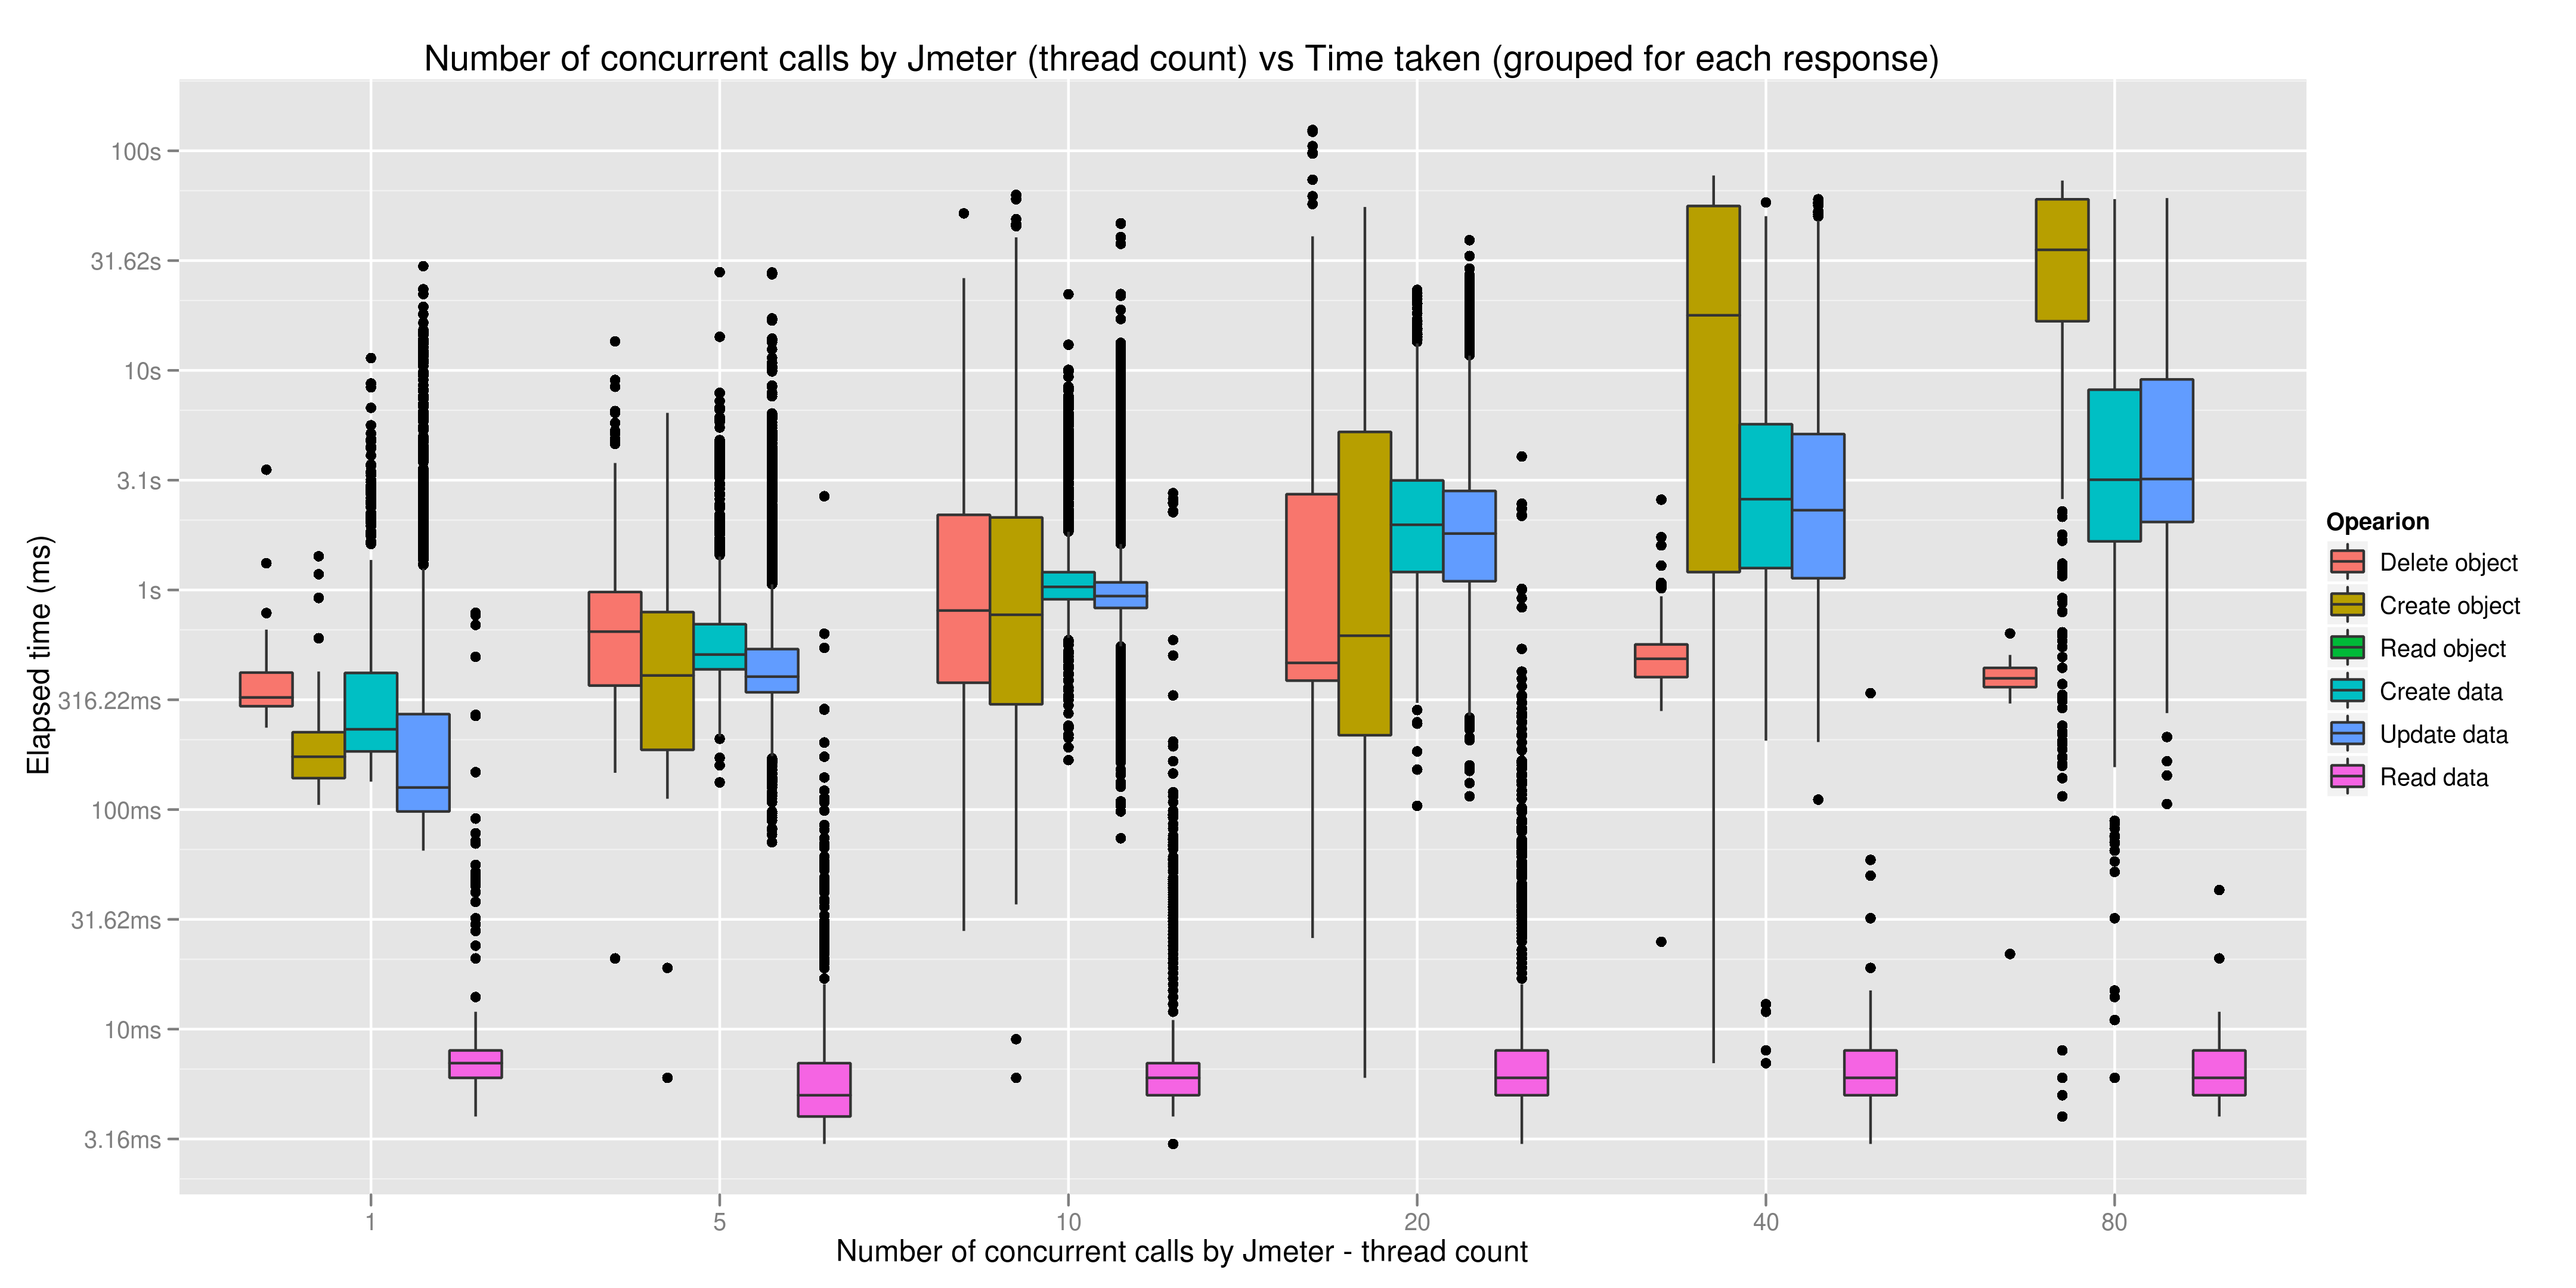
A box plot of Thread count vs Time taken to complete a response, for each of the operations
Analysing the test results
...
The code used to produce the graphs is in 'fedora-jmx.r'
- 2013-06-03: fedora-jmx.r
- 2013-04-25: fedora-jmx.r
To execute the code
$ R
> source('/path/to/the/file/fedora-jmx.r')
- The program will ask you to choose the directory which contains the test results (csv format)
- The test results were copied from futures6 /opt/ff-jmeter-madness/log to a machine where R is installed
- It will run through all the files, gather the data and produce 3 graphs and a summary of the data. These will be saved in your current working directory.